IN the Victorian port of Williamstown an old clock-faced machine once took the ocean’s pulse. Zig-zagging lines of ink kept track of the tides until technology changed and dust was permitted to frost its gears. More than a century on, scientists are returning to its charts to improve their understanding of how weather conditions affect our measurements of changing sea levels around the coast.
Year by year our oceans swell in size, drip-fed by melting glaciers and puffed up by the thermal expansion of a warming planet. As sound as climate change theory is, modelling this growth in detail is a real challenge – try recording the height of a squirming toddler as it runs amok, throwing tantrums and refusing to sit still.
That’s exactly what a marigram is, though. It’s a measurement of the periodic highs and lows of sea level as dictated by the beat of the tides and temperament of the winds. Today we also have satellites keeping constant watch, filling digital databases with their figures. Half a century ago we relied on a keen eye and diligent hand, if not the mechanical grind of a recording device, to keep record as stacks of paper and fading ink.
Somewhere in those lists of numerals and wavy lines are hints of a static median – a historical sea level we’d expect in the absence of Moon and weather. That’s important to discover if we’re to understand how global warming will continue to affect the oceans in the future. But exposing the millimetres of a creeping rise in the daily noise of surging water as well as the effects weather conditions have on them is made all that much harder when you need to take into account the fact that not all weather systems affect the sea in different locations in the same way.
“In Sydney, storm surges are caused typically by east coast lows,” explains climate scientist Kathleen McInnes from CSIRO Oceans and Atmosphere national research business unit.
“But in Melbourne, frontal lows are the common cause of storm surges.”

To work out how trends in the extreme sea level in different places might indicate changes in the weather, we need more than a handful of measurements taken in a couple of convenient spots. Unfortunately data is one thing researchers are in short supply of – to check how well climate models replicate other factors that influence sea levels, we currently rely on just two sets of records; one taken in Fremantle since 1880, and the other in Sydney, dating back to 1912.
Adding another century’s worth of observations taken from a third location would help build confidence and add much needed detail.
Following its instalment in 1859, Williamstown’s old mechanical tide gauge recorded the port’s sea level in an analogue ripple on the surface of a rolling drum, its turn commanded by the ticking of a clock. Not all of its records have survived, but those that did provide researchers with a valuable resource. All that’s required is to convert the meandering lines weaving across reams of paper into databanks that can be digitally analysed.
To manage this, a team of student volunteers has so far scanned more than a thousand charts and stored them as image files. Software can then be used to help the volunteers convert their lines into points against a set of axes, providing tables of coordinates chunked into time-based files.
Where a period of records is missing due to a malfunction in the gauge, another method of measurement can be slotted in.
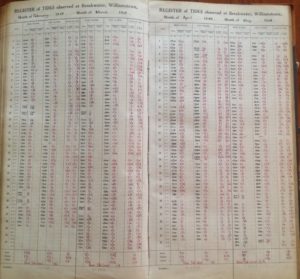
“There is another potential source of data that in some instances can fill in the gaps,” says McInnes. “When the mechanical gauge was not working, the operators would sometimes take a reading from a tide staff and enter these into books that recorded the high and low tide levels each day.”

Combined, the mechanical gauge’s marigrams and the volumes of hand-filled tide registers provided by harbour operators with its numbers read off the marigrams or tide staff if the gauge was not working, results in a ‘time series’ of the variation in the level of the sea on any given day off the coast of Williamstown.
“What we don’t know – and why we want to digitise the data – is how the weather might have been affecting the water levels on any given day, such as a severe storm causing a storm surge or a high pressure system causing slightly lower sea levels,” says McInnes.
The result of this time-consuming process is a library of daily figures that covers the ebb and flow of the sea virtually non-stop from the late 19th century until 1965 when recording went digital. Deviations from known tide levels can then be calculated and these deviations then allows researchers to investigate the causes of those deviations such as severe storms or climate variations such as El Nino.
Similar records tallied in old ledgers and on reams of yellowing paper have been produced in coastal towns all over the country, from Burnie to Townsville, Newcastle to Geraldton. On their own they capture a thin slice of history; added up, they play an important part in revealing how our oceans are affected by climate change. As with the Williamstown registers, these historical records might also soon have their numbers converted into binary code with appropriate funding.
Technologically speaking, we’ve come a long way since the port’s old mechanical tidal gauge churned out its daily ribbon of recordings. But its lines of ink are proving to be just as important as any byte of satellite data recorded today.
