Closing in on online hate speech with graph machine learning
Share
By
Alison Donnellan
29 August 20196 min read
Over three decades, the Internet has grown from a small network of computers used by research scientists to communicate and exchange data to a medium that has penetrated almost every aspect of our day-to-day lives. It’s hard to imagine a life without online access for business, shopping, and socialising.
But a technology that has connected humanity at a scale never before possible has also amplified some of our worst qualities. Online hate speech spreads virally across the globe with short and long term consequences for individuals and societies.
These consequences are often difficult to measure and predict. Online social media websites and mobile apps have inadvertently become the platform for the spread and proliferation of hate speech.
So using machine learning, StellarGraph’s team of graph analytics experts looked at whether we could detect hateful users based on their activities on the Twitter social network.
Our approach
StellarGraph’s work revolves around releasing cutting-edge research in an applied way. We create tools that empower data scientists to build, test and experiment with machine learning models to create value from network data.
There are countless examples of rich network datasets being underutilised across industries; in our capacity as one of CSIRO’s Data61 projects we’re working to show how machine learning on graphs can transform Australia’s data science capability through the discovery and connection of data insights.
In this case study, we developed and compared two machine learning methods for classifying a small subset of Twitter’s users as hateful, or not hateful. To do this we used a freely available dataset of Twitter users published in 2018 by researchers from Universidade Federal de Minas Gerais in Brazil.
First, we employed a traditional machine learning method - a logistic regression model, aka a statistical math model used to show the probability of a certain situation, providing clear yes/no-style answers - to data estimate the probability train a classifier based on users’ vocabulary and social profiles.
Next, we applied a state-of-the-art graph neural network (GNN) machine learning algorithm called Graph Sample and Aggregate (GraphSAGE) to solve the same problem, but we added in the relationships between users.
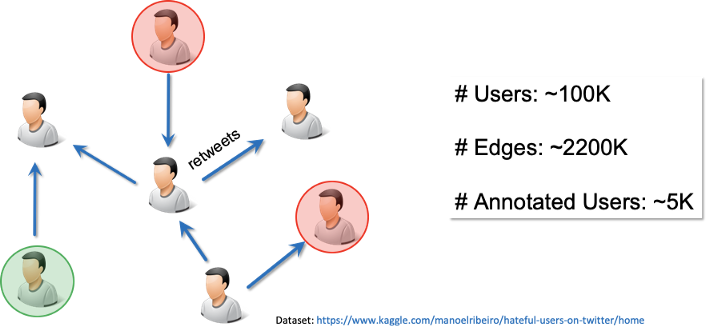
The hateful Twitter dataset structure and basic statistics.
The dataset
The dataset covers 100,368 Twitter users. For each user, a number of activity-related features are available such as the frequency of tweeting, the number of followers, the number of favourites, and the number of hashtags.
An analysis of each user’s lexicon derived from their last 200 tweets also yielded a large number of features from language content. Stanford’s Empath tool was used to analyse each user’s lexicon in categories such as love, violence, community, warmth, ridicule, independence, envy, and politics, and assign numeric values indicating the user’s alignment with each category.
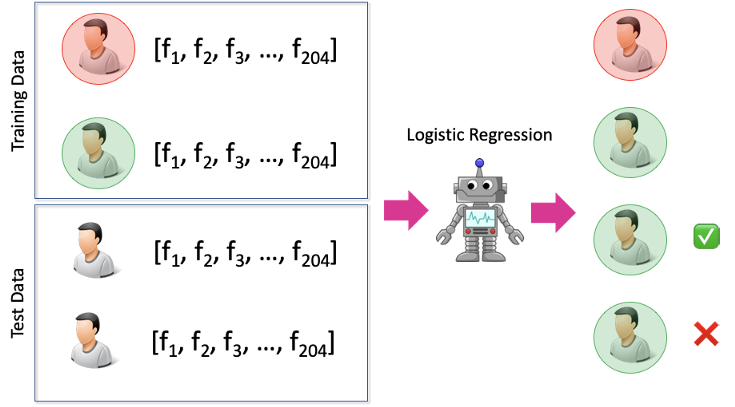
In total, we used 204 features to characterise each user in the dataset. For each user, we collect these features to form a 204-dimensional feature vector to be used as input to a machine learning model for classifying users as hateful or normal. The dataset also includes relationships between the users. A user is considered connected with another user if the former has re-tweeted the latter. This relationship structure gives rise to a network which is different to Twitter’s network of follower and followee relationships.
Finally, users were labelled as belonging to one of three categories: hateful, normal, and other. Out of ~100k users in the dataset, only ~5k were manually annotated as hateful or normal; the remaining ~95k users belong to the other category meaning they haven’t been annotated.
This considered, we faced two key challenges: firstly, only a small subset of users was annotated as hateful or normal, with majority of users’ labels unknown (other category). Secondly, the labelled data is highly imbalanced in terms of label distribution: out of the ~5k annotated users, only ~500 (~10%) have been annotated as hateful and the remaining as normal.
The setup for training and evaluating a logistic regression model for online hate speech classification.
Logistic regression model
We began by training a logistic regression model to predict a normal or hateful label for a user.
When training and evaluating this model, we ignored the ~95k users that are not annotated as normal or hateful, as well as the relationships between users. This is due to lack of direct support for such information in logistic regression.
Graph Neural Network model (GraphSAGE)
The GNN model jointly exploits user features and relationships between all users in the dataset, including those users that are not annotated.
GraphSAGE introduces a new type of graph convolutional neural network layer (a specialised type of computer software inspired by biological neurons, a neural network is a method used to create artificially intelligent programs, and in this case, the neural network model was designed to work with one, two or three-dimensional image data) that propagates information from a person, or in this case, a node’s neighbourhood while training a classifier.
It builds on the insight that a prediction for a node should be based on the node’s feature vector but also those of its neighbours, perhaps their neighbours as well, and so on. Using the example of classifying hateful users, our working assumption is that a hateful user is likely to be connected with other hateful users.
The outcome
Comparing the two machine learning models allowed us to see whether using the additional information about unlabelled users and relationships between users actually helped to make a better user classifier.
Assuming we are willing to tolerate a false positive rate of approximately 2%, the two models achieve true positive rates of 0.378 and 0.253 for GraphSAGE and logistic regression respectively.
We can correctly identify more hateful user for the same low number of misclassified normal users. So, for a fixed false positive rate of 2%, the GraphSAGE model achieves a true positive rate that is 12% higher than the logistic regression model.
By using the relationship information available in the data, as well as the unlabelled user information, the performance of a machine learning model on sparsely labelled datasets with underlying network structure is greatly improved.
Conclusion
We’ve not only demonstrated that modern graph neural networks can help identify online hate speech at a much higher accuracy than traditional machine learning methods, but that graph machine learning is a suitably powerful weapon in the fight against online hate speech.
While there is room for improvement, the results certainly provide encouragement for additional research for online hate speech classification with larger network datasets and more complex GNN methods.
To learn more about how to use state-of-the-art graph neural network models for predictive modelling, have a look at the StellarGraph graph machine learning library and the numerous accompanying demos.
We have received your enquiry and will reply soon.
We're Sorry
The contact form is currently unavailable. Please try again later. If this problem persists, please call us with your enquiry on 1300 363 400 or +61 3 9545 2176. We are available from 9.00 am to 4.00 pm AEST Monday - Friday.