As we can’t see radio waves with our own eyes, we process data from radio telescopes into beautiful and unusual images. And the data from our ASKAP radio telescope is no exception.
ASKAP is situated on Inyarrimanha Ilgari Bundara, our Murchison Radio-astronomy Observatory in Western Australia. While our newest radio telescope is still in its pilot stage, it continues to produce ground-breaking science. The data it collects is analysed in supercomputers including those at the Pawsey Supercomputing Research Centre.
In celebration of its world-class capabilities, we’ve collected the top 10 images from ASKAP data.
Creating pieces of art for research
The ASKAP radio telescope is the central research instrument for nine survey science teams:
- CRAFT
- DINGO
- EMU
- FLASH
- GASKAP-HI
- GASKAP-OH
- POSSUM
- VAST
- WALLABY
Occasionally, this data becomes an image that can support data from other telescopes, like the Anglo-Australian Telescope or the James Webb Space Telescope. But not all teams need to produce imagery for their research. Many teams keep data in graphs, plots, tables and spreadsheets.
Astronomy is a hugely diverse field that involves more than looking at pretty pictures. But beautiful imagery is something we can all enjoy.
Top 10 images from ASKAP
These images are just the beginning of many research projects. From here, teams will analyse the data further to discover even more about our Universe.
10. Polarised intensity around a supernova remnant, POSSUM
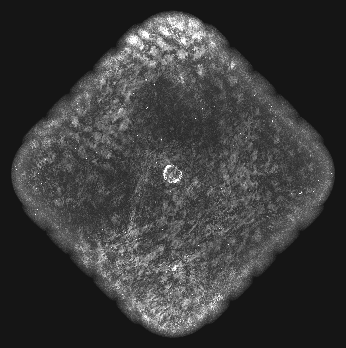
The science survey team, POSSUM (Polarization Sky Survey of the Universe’s Magnetism), generated this image. It is of the polarised emissions from gas clouds, interstellar dust and background galaxies. The shell in the centre is the supernova remnant (SN1006) – the remaining shock wave of gas long after a star has exploded. Looking at the patterns of the polarised gas, researchers hope to understand the magnetic fields at play in this part of our Galaxy.
9. Orbiting patterns of galaxies in the Hydra cluster, WALLABY
The WALLABY (Widefield ASKAP L-Band Legacy All-Sky Blind Survey) team look at hydrogen gas in the Universe. In this image, data from the gas shows the movement of galaxies in the Hydra galaxy cluster. The white haze represents the density of hot intra-cluster gas and dust that is typical of massive clusters. The galaxies’ colour represents their orbital movement within the cluster. Red galaxies are moving away from us, blue is moving towards us, and green is in between!
8. The SWAG-X region, ASKAP
Windows into the extragalactic Universe are mapped with different telescopes on Earth and in space. These surveyed areas allow researchers to explore and understand the Universe in X-ray, optical, infrared and other wavelengths simultaneously.
This image of SWAG-X (Survey With ASKAP of GAMA-09 + X-ray[Link will open in a new window]) is one of those regions. It adds radio wave data to the existing GAMA-09 (optical data from the Anglo-Australian Telescope), eFEDS (X-ray data collected by the eROSITA space telescope), and many other wavelengths. This map is full of radio data ready for scientists all over the world: each little dot is an entire galaxy.
7. Galaxy running towards collision, EMU
An international team combined data from ASKAP, SRG/eROSITA, XMM-Newton and Chandra satellites, and DECam optical images. And they discovered a large galaxy with a black hole at its centre, moving at high speed.
The red streaming gas, showing this movement, was from ASKAP data produced by the EMU (Evolutionary Map of the Universe) team. The contour lines also map radio wave intensity to tell researchers the areas of gas and excited particles.
6. Spinning in space, WALLABY
Colour often describes density or temperature variations. But in this image, colour is all about movement. This is a map of galaxies that indicates how each individual galaxy is moving. Blue means it is rotating towards us, red away. So, can you work out how each galaxy is moving? For ease, the galaxies have been magnified by a factor of four.
5. Spot the mysterious signal, VAST
In one of our biggest astronomy stories for 2021, ASKAP detected a mysterious signal coming from the centre of our Milky Way. This image with pull-out shows the position and sudden appearance of the signal. The VAST (Variable and Slow Transients) team scan the sky with ASKAP. They look for radio sources that are erratic like flaring stars, pulsars, magnetars, and the orphan afterglows of gamma-ray bursts. So far, we don’t know what this strange signal is.
4. Dancing Ghosts, EMU
In another mystery, ASKAP spotted these two 'dancing ghosts'. However, the 'ghosts' are really just clouds of energetic particles spewing from the black-hole centres of two galaxies.
But the shape of these clouds does not fit into our typical models. Therefore, there must be other forces at play. Researchers are yet to determine what they are. The clouds, captured by ASKAP, are overlayed on an optical image from the Dark Energy Survey.
3. Galactic Plane, EMU
Studying the Galactic Plane is an essential objective for astronomers. It is where our Solar System resides alongside millions of stars, dust and gas clouds, plus dark matter. This was ASKAP’s first view of a small portion of the Galactic Plane.
The team discovered more than 3600 compact radio sources – many of which had never been seen before. Even more amazing, this data was acquired by only 15 of ASKAP's 36 antenna. There will be even greater things to discover now that all 36 antennas are operating together.
2. Large Magellanic Cloud, Early Science
The early science projects were all about finding out what ASKAP could achieve. After a year of processing, new images of the Large Magellanic Cloud were unveiled, including this one of the Tarantula Nebula and its surrounds. These images provide a benchmark for researchers to study in greater detail how stars form and how galaxies are structured.
1. Small Magellanic Cloud with filaments, GASKAP-HI
This is the best image yet of our neighbouring galaxy in radio waves. It was created by data from both ASKAP and Murriyang, our Parkes radio telescope. The GASKAP-HI (Galactic ASKAP – neutral hydrogen) team are now mapping the filament structure of the galaxy’s gas from the data. This will tell us more about where and how stars form. And perhaps why this galaxy is such an irregular shape.
Researchers have only just started this analysis, as seen in the bottom right-hand corner, and will be publishing their findings in 2022. You are one of the first to see the beginnings of this filament map!
We acknowledge the Wajarri Yamaji as the Traditional Owners and Native Title Holders of Inyarrimanha Ilgari Bundara, our Murchison Radio-astronomy Observatory site where ASKAP is located, and the Wiradjuri people as the Traditional Owners of the Parkes Observatory.