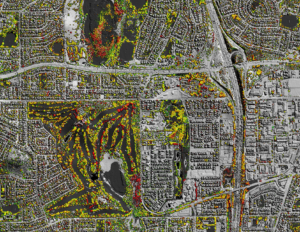
Australia’s cities are changing constantly as a result of natural forces as well as human decisions like population flux, services and planning. We can see that just by looking at photographs, particularly photos taken from above.
In fact, the high quality digital photography available in the modern world allows unparalleled opportunities to monitor and analyse urban environmental changes.
With a resolution down to 20 cm or better, aerial photographs can show details of the variations in land surfaces and urban environment features such as roofs, roads, irrigated and non-irrigated trees, bushes and lawns. The resolution and frequency of image capture is expected to improve even further over time, opening new possibilities for scientific analysis.
Applying science to monitor change
CSIRO research teams in Perth and Melbourne have been using high resolution photographs in novel ways to monitor changes in the environment.
The Perth-based team have developed a way to automate the processing and analysis of digital aerial photography, based on standardised data and methods, which is able to track and communicate land cover and structural changes.
According to Urban Monitor® project leader, Dr Peter Caccetta of Data61 (a recent merger of NICTA with CSIRO’s Digital Productivity), the team has solved a number of technical problems that have allowed digital photography to be a valuable mapping and monitoring tool.

The process uses a series of photos taken over time. The time series of images are calibrated to ground reflectance and high resolution digital surface models so that changes in the urban landscape can be accurately observed over time.
In collaboration with Western Australian State Government agencies and the Australian Goverment Department of Environment, the approach has been applied to estimating the extent of urban forest in the Perth and Peel region.
Meanwhile in Melbourne, Dr Greg Foliente and his team from CSIRO’s Liveable, Sustainable and Resilient Cities program have been using analyses of aerial photos to produce Geographic Information System (GIS) data sets, also known as map layers.
The Melbourne researchers have developed a set of clever computer algorithms and, in one particular application, deployed them through CSIRO’s supercomputing facility to automate the GIS mapping of footpaths in metropolitan Melbourne. The map layers are detailed enough to show the width of a footpath.
This work was commissioned by the Australian Urban Research Infrastructure Network (AURIN), with funding provided by the Federal Government, to whom CSIRO have provided urban data products covering the metropolitan Melbourne footpath network and building footprints.
Let the computers do the grunt work
Traditional, more manual, methods of generating this sort of information about urban environments are very expensive and time consuming and not very suitable for today’s fast changing cities, where frequent updates are required.
Up until now, the alternative was to send an army of people to manually move around the neighbourhoods mapping the exact locations of footpaths in detail until they have covered the entire city.
So why not just use Google?
While the human eye can easily differentiate objects and their functional characteristics in photographs, even the low-resolution ones available from Google Earth, it is not easy to obtain reliable, accurate and quantified information for specific objects—such as a footpath network—for large areas or even an entire city. And it’s this level of information that is necessary for research and analysis of urban change.
That’s why the research teams are using a combination of supercomputing technology and high resolution photography, such as images of Melbourne supplied by the Victorian Department of Environment, Land, Water & Planning.
“We are letting the computer recognise patterns and urban environment characteristics,” Felix Lipkin said, the technical research lead for the CSIRO project.
Once these patterns have been detected they can be analysed for changes and to identify any particular planning issues like potential exposure to natural hazards and the accessibility of footpaths for travel and recreation needs.
The CSIRO research teams are not only using photographs and the latest computing technology to monitor what is happening in Australian cities but also map their progress. This in turn can help with better policies to improve community wellbeing, urban resilience, housing, city and infrastructure planning and natural resource management.
