The Bureau of Meteorology and CSIRO play an important role in monitoring, analysing and communicating observed changes in Australia’s climate.
[Animation of globe and data points]
This is our fourth State of the Climate report.
The report focuses on observations and data which show how the climate is changing.
[Animation of mountains and sea, with floating icons]
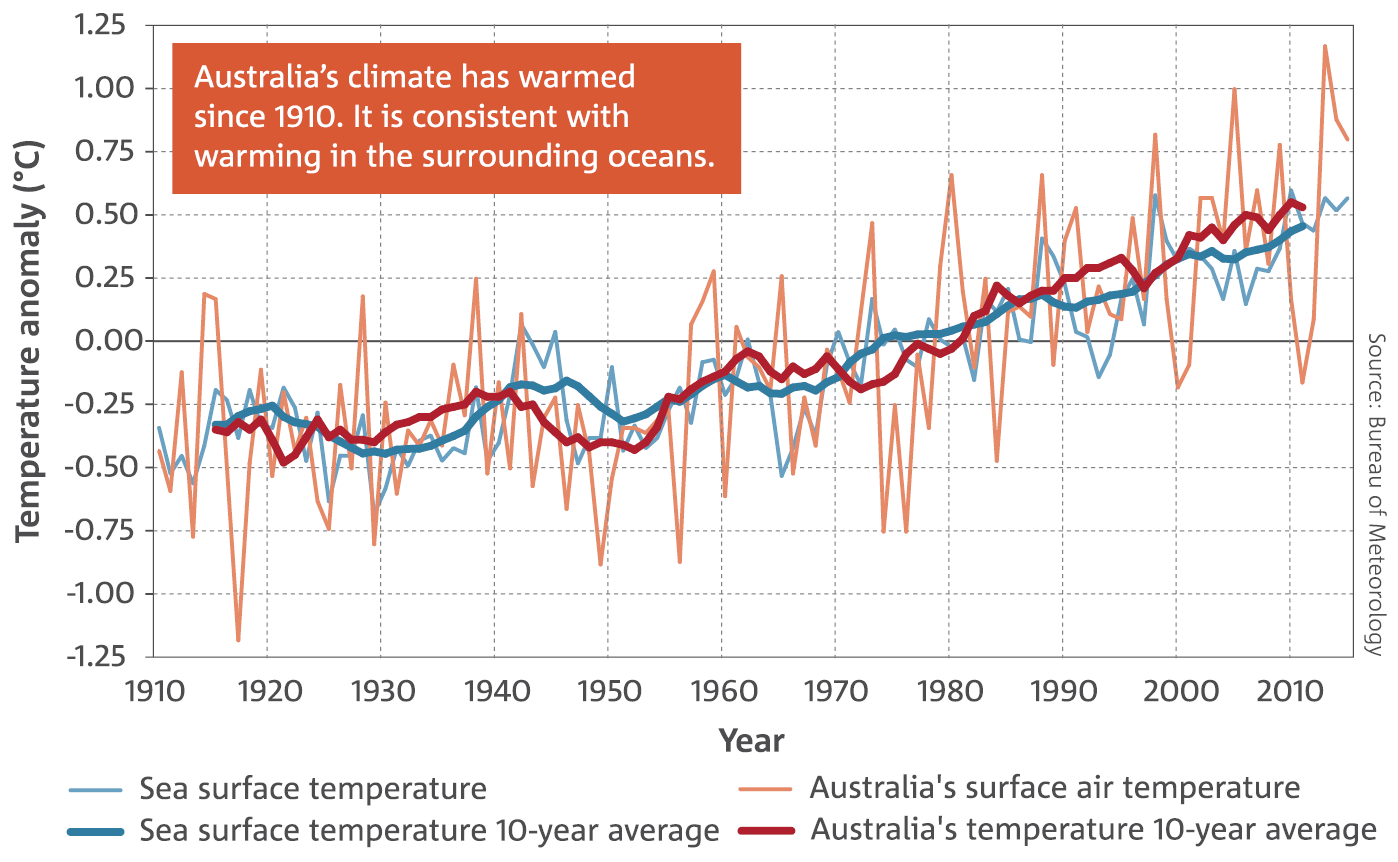
Since 1910, Australia and the surrounding oceans have warmed by around one degree.
[Graph of air and sea temperatures since 1910, with upward trend]
And whilst not every year will be warmer than the last, the overall warming trend is projected to continue.
[Animation of a line of red and blue thermometer icons with an upward trend.]
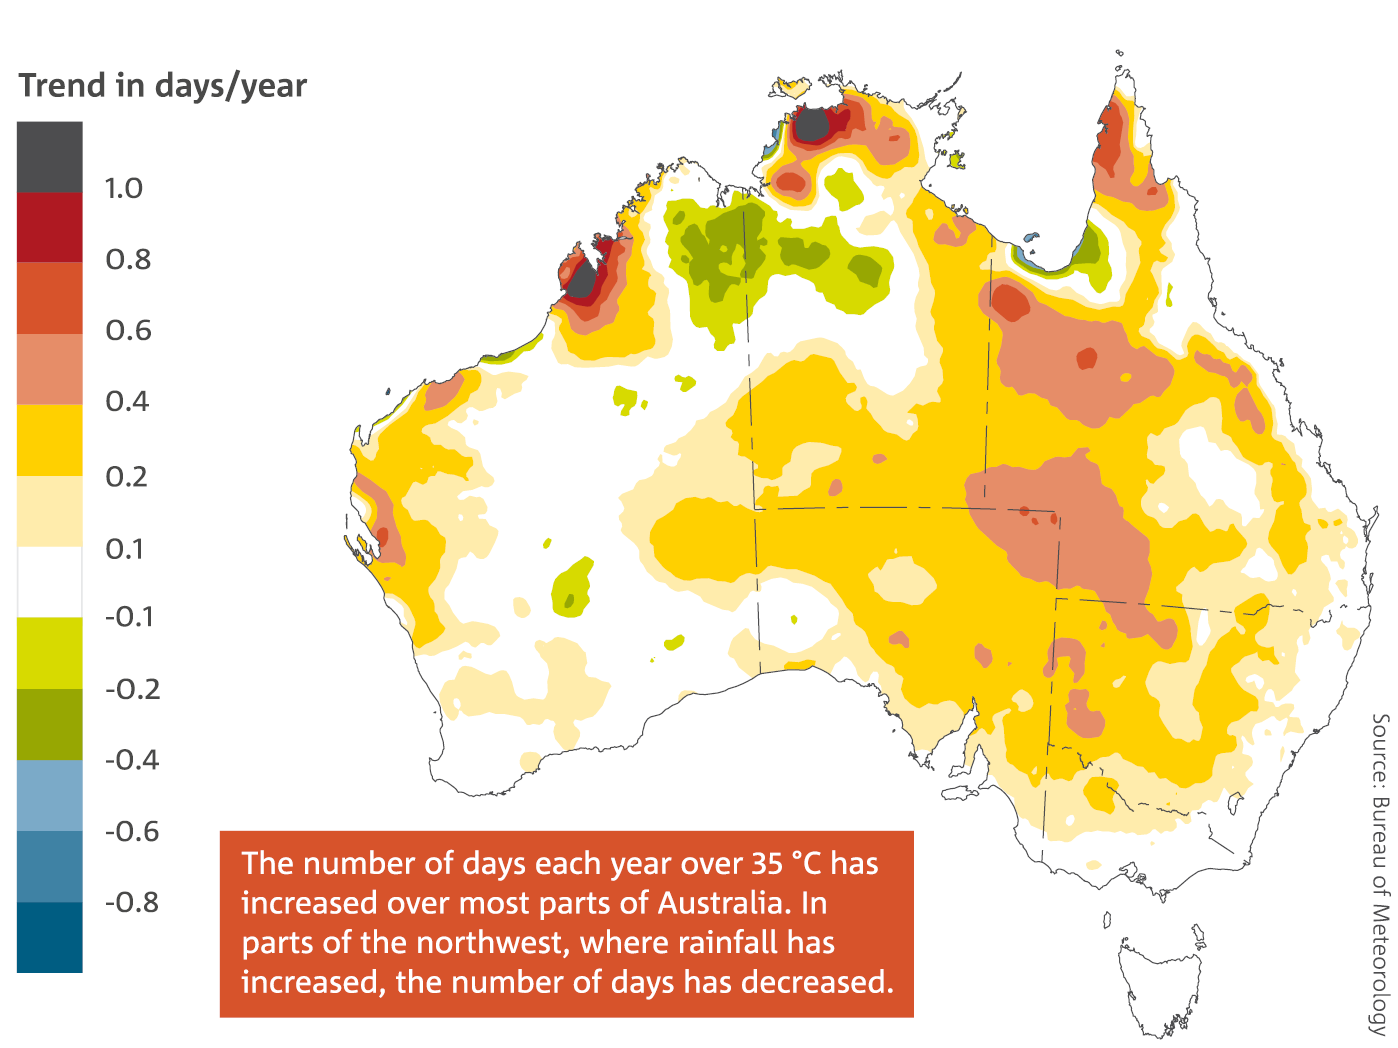
We expect fewer cool days and more hot days.
[Focus on some blue icons, then many red icons.]
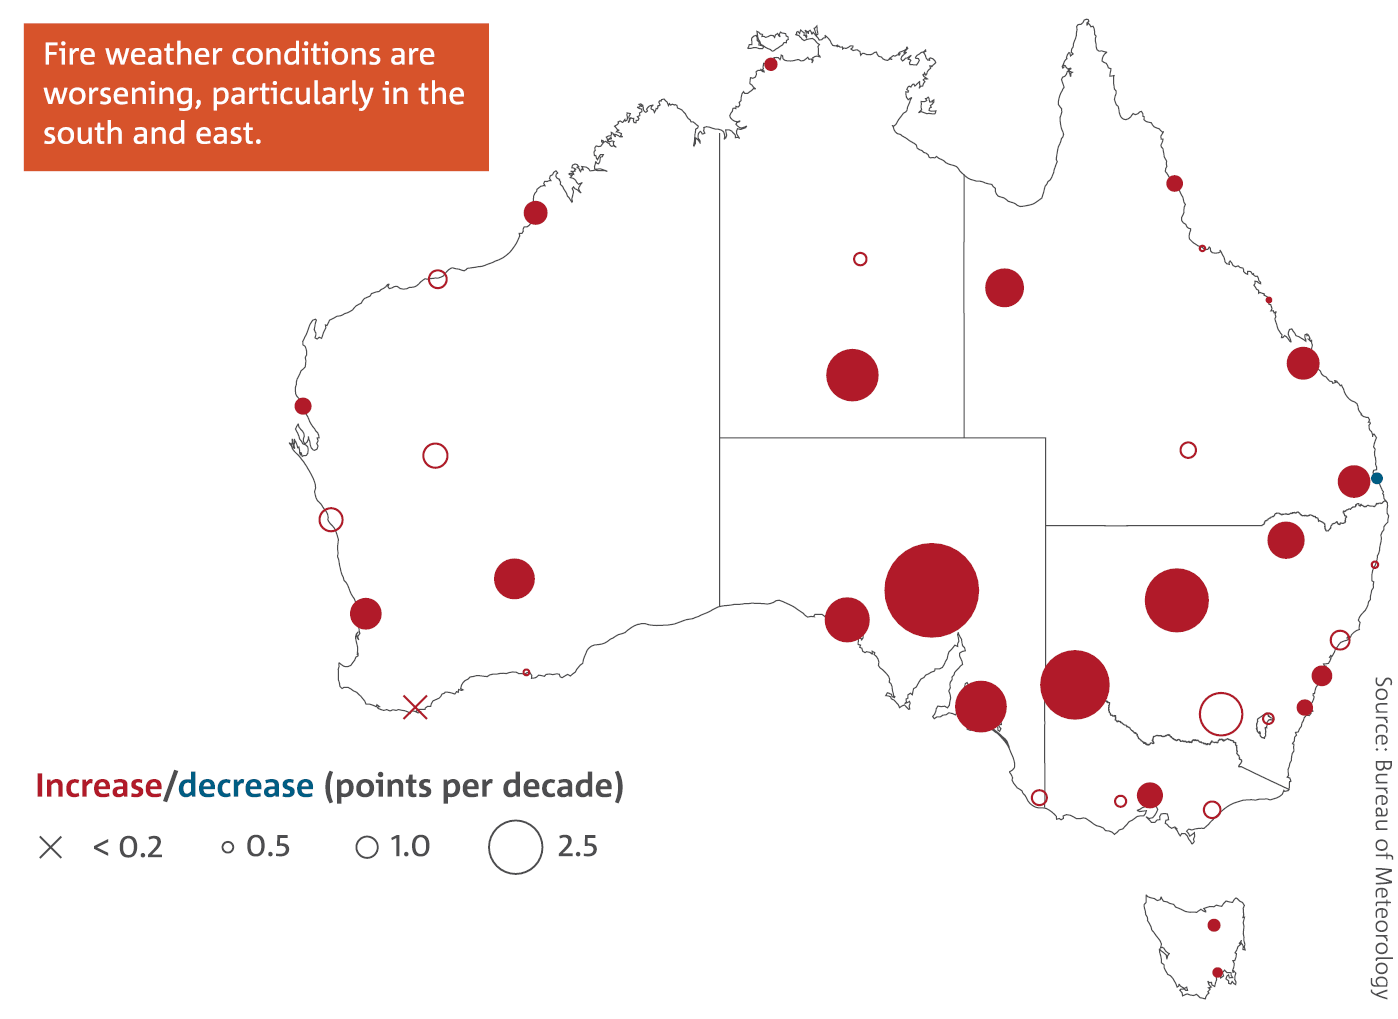
Since the 1970s, there has been an increase in extreme fire weather, and the season is longer.
[Animation of green landscape with developing smoke plumes. Fire danger scale swings to extreme.]
We expect more fire weather days, especially in southern and eastern Australia.
[Animation of 4 developing smoke plumes. Fire danger scale points to extreme.]
Australian rainfall is variable, naturally swinging between very wet and dry.
[Icons alternate between blue cloud icon with rainfall, then yellow cloud icon with rainfall crossed out.]
However long-term changes in rainfall are occurring.
In the last few decades northern wet season rainfall has been very much above average.
[Rainfall map for October to April 1995-2016 shows above average rainfall for much of Western Australia, but below average in southwest Western Australia. Rainfall is above average in the Northern Territory.Rainfall is average to above average for inland and northern QUeeensland, most of Southe Australia, and inland New South Wales.Rainfall for October to April 1995-2016 is below average for southeast Queenland, southeastern New South Wales, Victoria and Tasmania.]
During the April to October growing season there has been an overall decline in rainfall across southern Australia, especially in the southwest.
[Rainfall map for April to October 1996-2015 shows below average rainfall in southwestern Western Australia; also in Tasmania, Victoria, adjacent South Australia and southern New South Wales. Rainfall is below average in southern Queensland except the tropical north. Drought icons are placed over southwestern Western Australia and southeast Australia.]
Southeast Australia has seen below-average rainfall in sixteen of the past twenty growing seasons.
We expect winter rainfall across parts of southern Australia to decrease, with more time spent in drought.
[Animation of green field of wheat turning brown.]
The oceans around Australia have warmed and there is an increased level of acidity.
We expect these trends to continue.
[Animation of fish under the sea, with increasing pH symbols and downward arrow.]
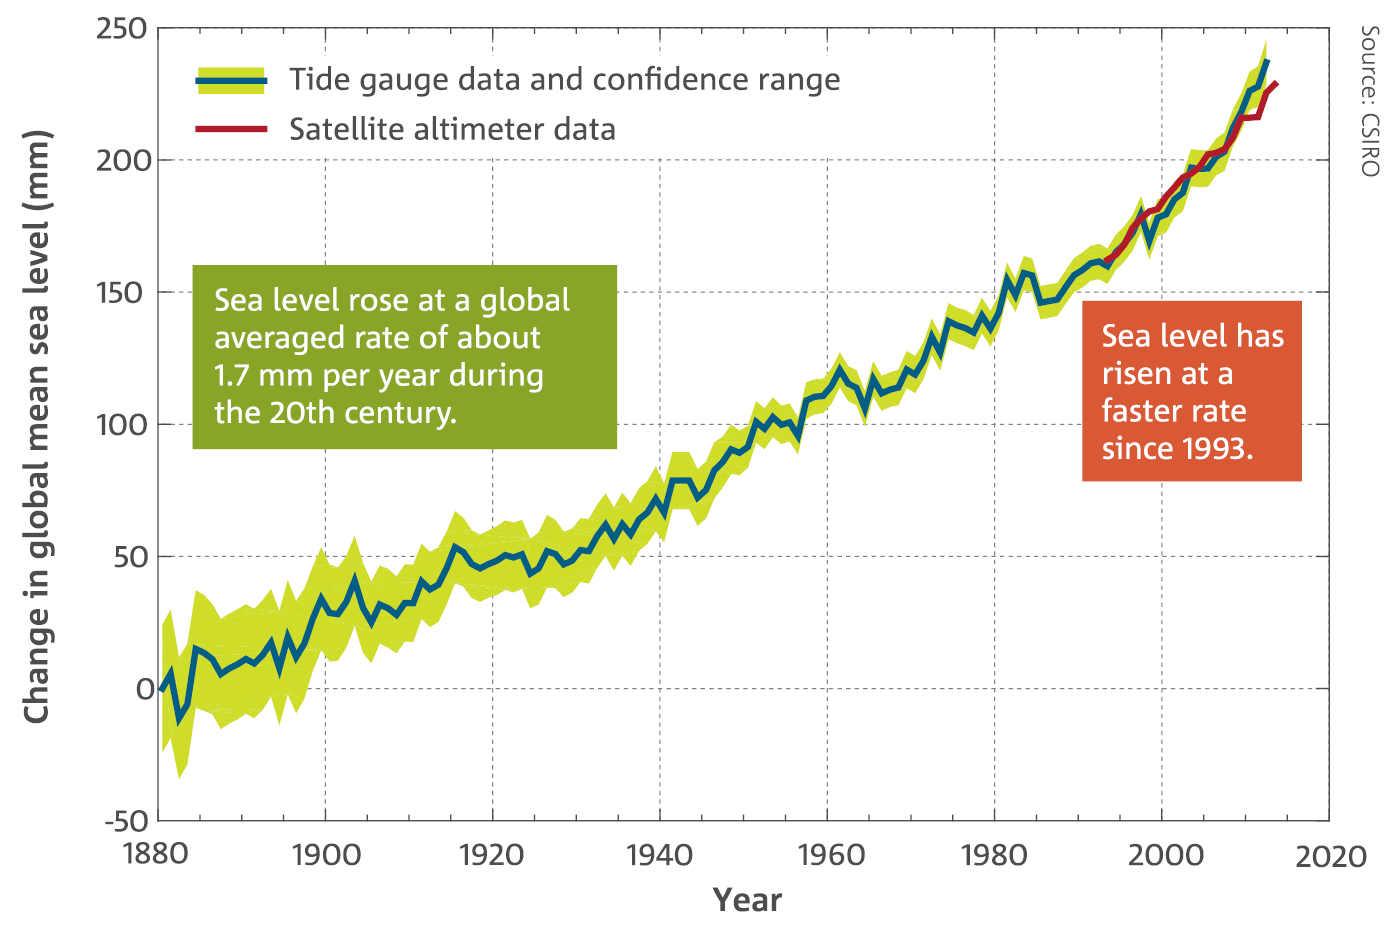
Sea levels have risen globally and around Australia, and are projected to rise further in the future.
[Graph of global mean sea level anomalies, with upward trend.]
For more information, and to understand more about our changing climate, visit our websites.
[Websites are www.bom.gov.au and www.csiro.au ]
The biennial CSIRO and Bureau of Meteorology State of the Climate report draws on the latest climate monitoring and science to show how our climate is changing.
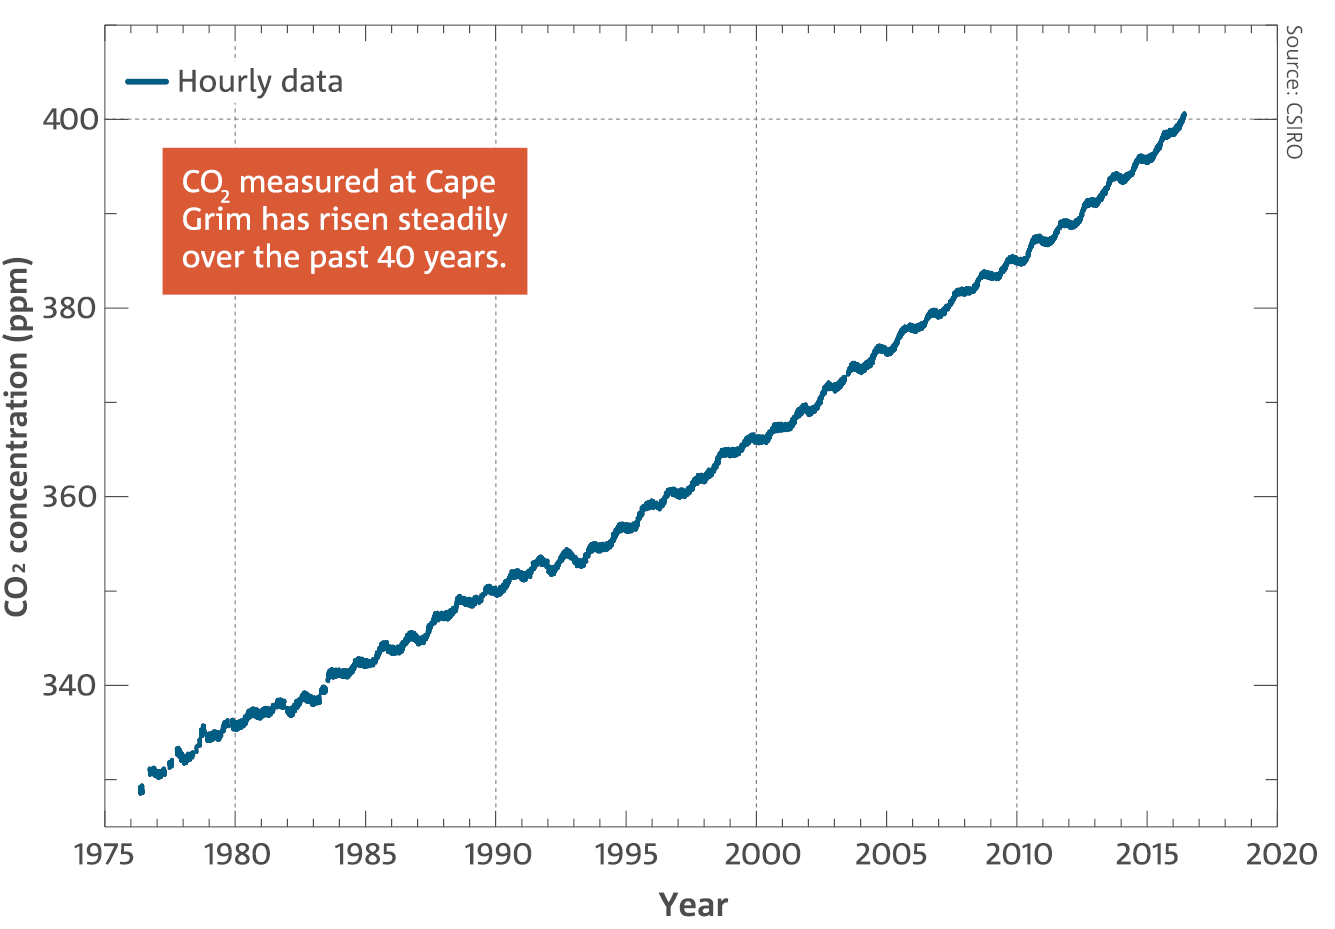
CSIRO Senior Scientist and leader of the NESP Earth Systems and Climate Change Hub, Dr Helen Cleugh said the changes were due to an increase in greenhouse gases such as carbon dioxide (CO2) in the atmosphere, which act like a blanket by keeping heat in the Earth’s lower atmosphere.
“Carbon dioxide is measured in parts per million,” Dr Cleugh said.
“Before around 1750, the level of CO2 was 278ppm. This year the Earth will record a global annual average of over 400ppm, the highest level in the past two million years.”
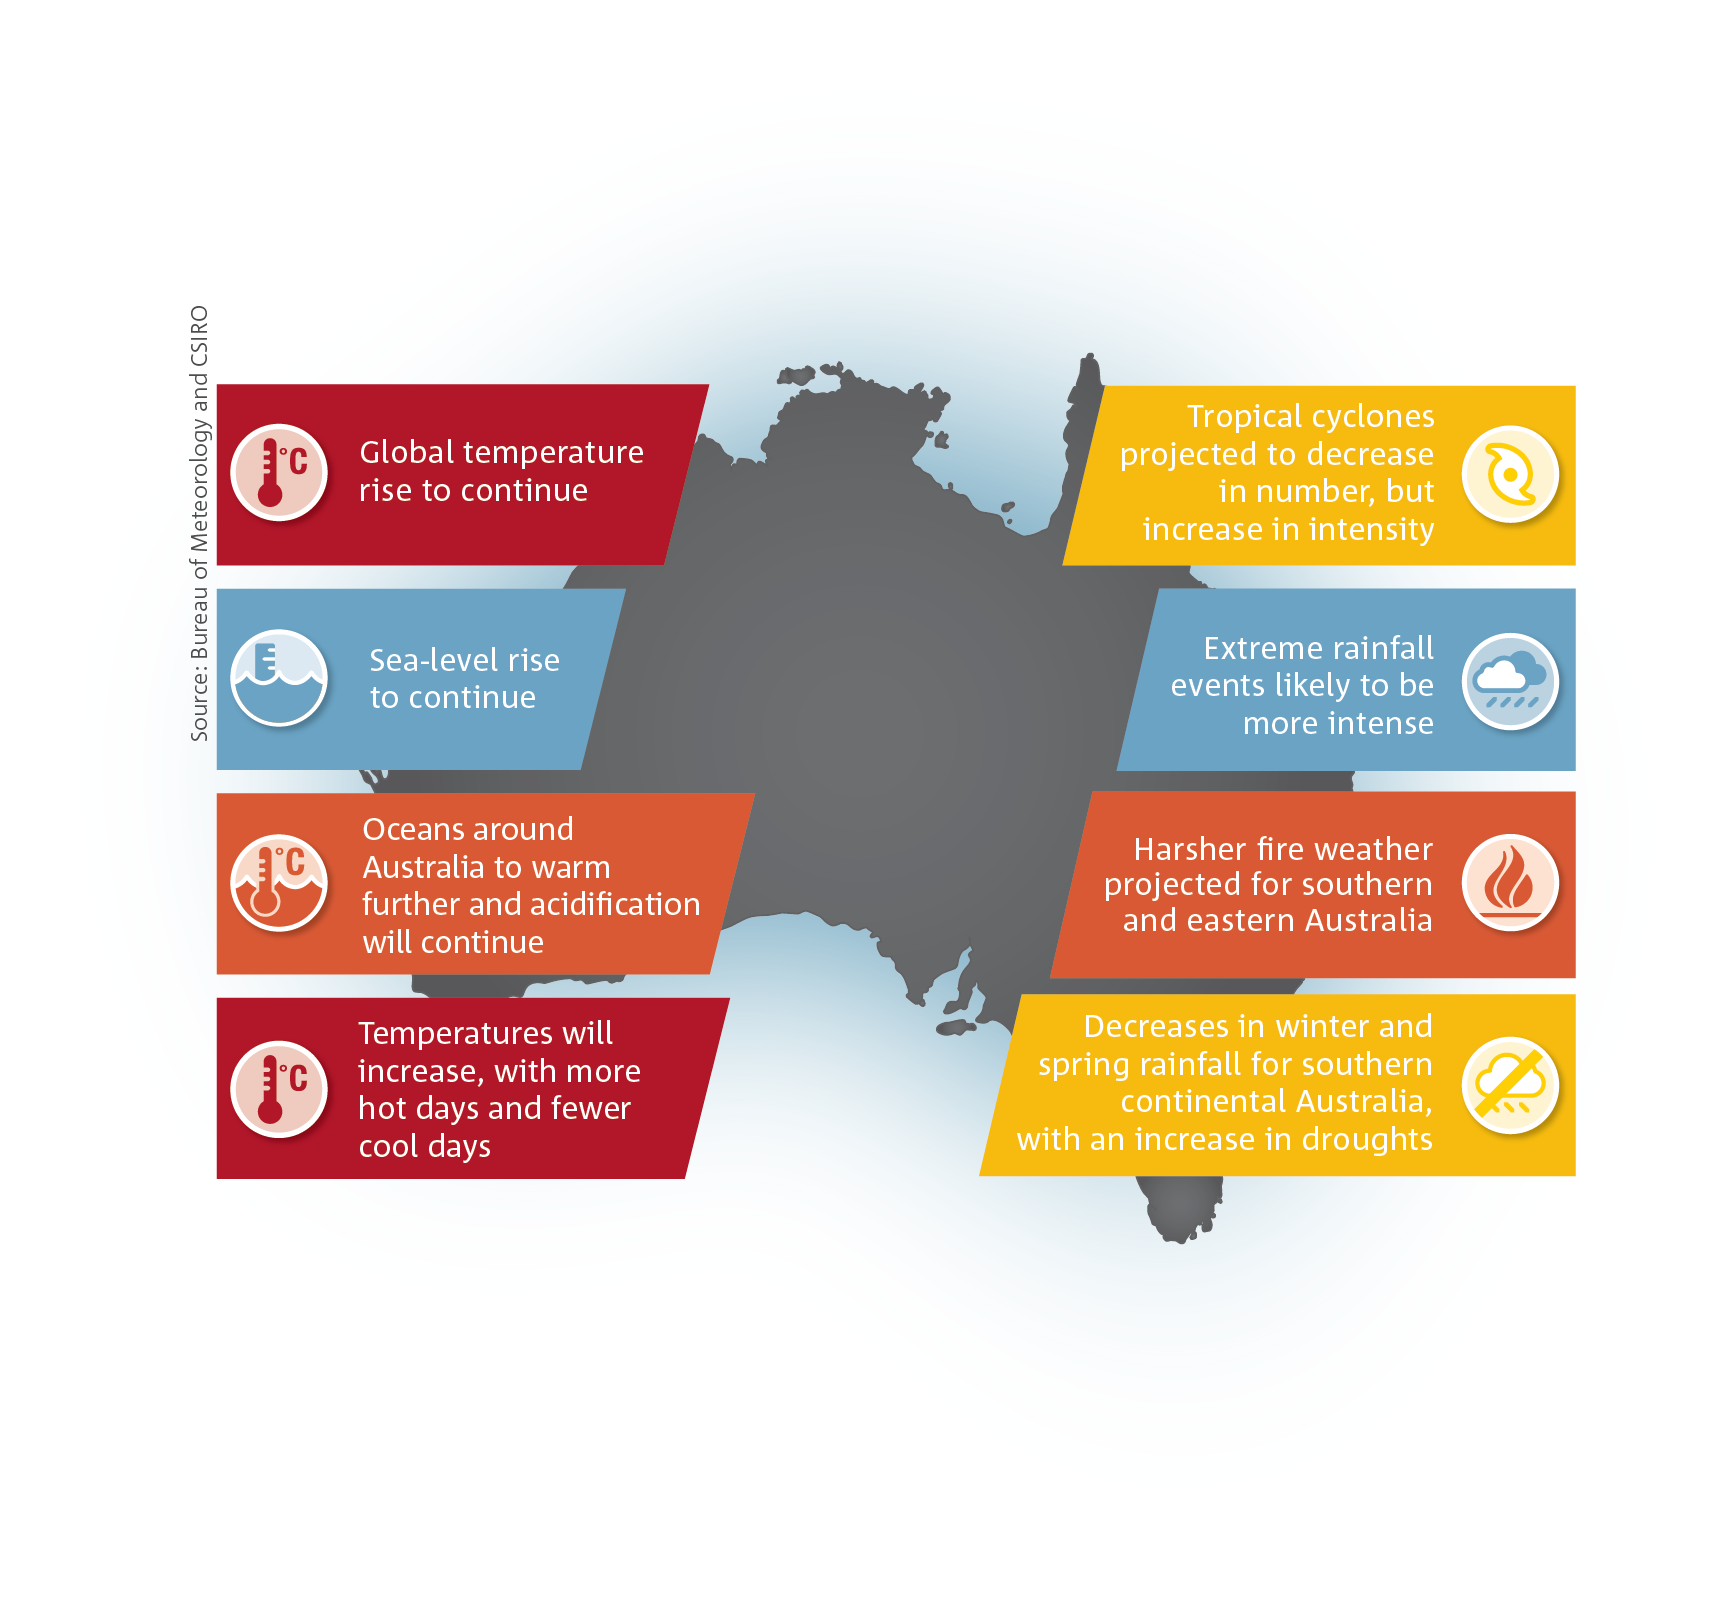
“Australian temperatures will almost certainly continue to increase over the coming decades. Temperature projections suggest more extremely hot days and fewer extremely cool days.
“As land temperatures increase, so do ocean temperatures and the report shows that the deep ocean is also impacted, with warming now recorded at least 2000 meters below the sea surface.”
The Bureau of Meteorology’s Manager of Climate Monitoring, Dr Karl Braganza said Australia was already experiencing the effects of climate change with record-breaking heat now becoming commonplace across the country.
“Australia experienced its three warmest springs on record in 2013, 14 and 15,” Dr Braganza said.
“Temperature and rainfall during this period is critical to southern Australia’s fire season.
“We’ve already seen an increase in fire weather and a longer fire season across southern and eastern Australia since the 1970s. In these regions the number of days with weather conducive to fire is likely to increase.
“Whilst the observations show us increased rainfall in some parts of Australia, we have also seen significant seasonal decline, such as in the April-October growing season where an 11 per cent decline in rainfall has been experienced in the continental southeast since the mid-1990s.
“The changing climate significantly affects all Australians through increased heatwaves, more significant wet weather events and more severe fire weather conditions.
“Some of the record-breaking extreme heat we have been seeing recently will be considered normal in thirty years’ time.”
State of the Climate 2016 is the fourth report in a series published biennially by CSIRO and the Bureau of Meteorology, which together play an integral role in monitoring, measuring and reporting on weather and climate.
The State of the Climate 2016 report can be found on the Bureau of Meteorology or CSIRO websites.
Fast facts:
- Australia has warmed by around 1 °C since 1910.
- The number of days per year over 35 °C has increased in recent decades, except in parts of northern Australia.
- There has been an increase in extreme fire weather, and a longer fire season, across large parts of Australia since the 1970s.
- May–July rainfall has reduced by around 19 per cent since 1970 in the southwest of Australia.
- April–October growing season rainfall has reduced by around 11 per cent since the mid-1990s in the continental southeast of Australia.
- Rainfall has increased across parts of northern Australia since the 1970s.
- Global sea level has risen over 20 cm since the late 19th Century with about one third of this rise due to ocean warming.
- The 2016 global annual average CO2 level will almost certainly exceed 400 ppm.
- The overwhelming contribution to the additional CO2 in the atmosphere is from human activities, mainly the burning of fossil fuels.
- The atmospheric CO2 increases in 2015 were the highest ever observed.