
Seeing the unseen
Australia’s landscapes are vast, diverse and often remote. Understanding what’s happening across them in real time has always been a challenge. But a new generation of Earth‑observation technology is giving scientists, farmers, environmental managers and industry a clearer view than ever before.
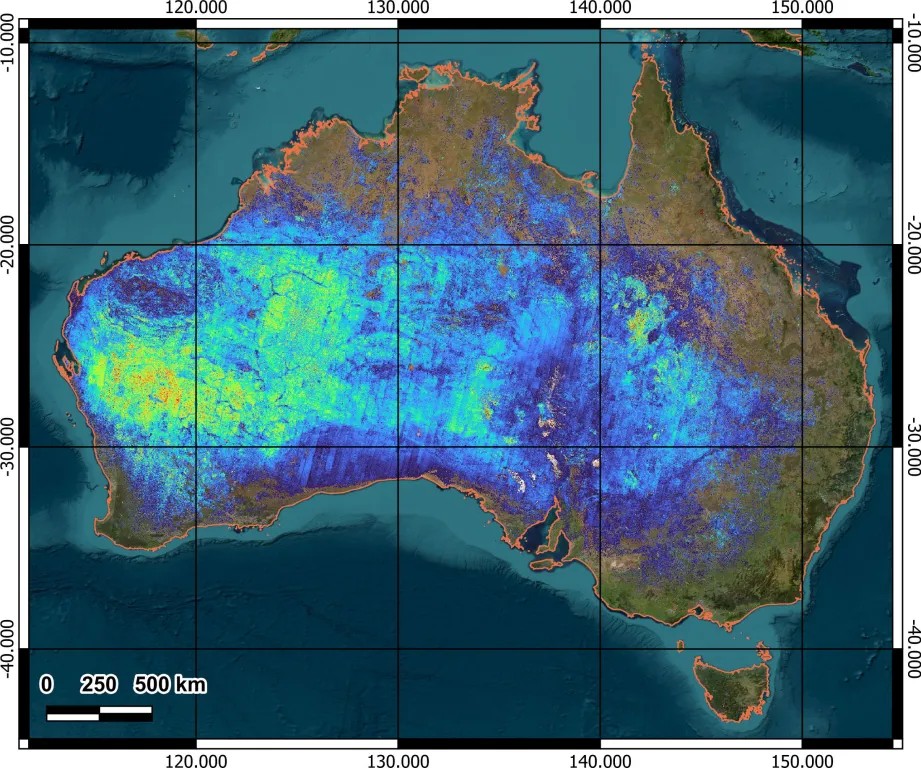
Hyperspectral satellites don’t just take pictures. They measure more than 200 narrow wavelengths of light reflected from the Earth’s surface, revealing chemical and physical details that the human eye, and even regular satellite images, can’t detect. The result is a ‘spectral signature’ for everything from soils and rocks to crops, waterways and reefs.
So, how is hyperspectral data captured, what does it show and how is it helping Australia care for our country, grow food more sustainably and explore mineral resources responsibly?
What is hyperspectral sensing?
Every material on Earth interacts with sunlight in a slightly different way. When light hits the ground, some wavelengths are absorbed and others are reflected.
Hyperspectral sensors measure these reflected wavelengths in dozens or even hundreds of extremely narrow bands.
One way to understand this advance in satellite sensing is to imagine earlier multi-spectral imaging as like listening to 14 notes on a piano whereas hyperspectral sensing is like hearing the full orchestra! That extra detail lets analysts identify materials based on their spectral ‘signature’ — a unique pattern of composition and chemistry encoded in the reflected light.
Plants, minerals, soil types, algae, pollutants, water quality indicators all have distinct spectral characteristics. Hyperspectral imagery makes those differences visible.
Collecting hyperspectral data
Most hyperspectral data come from satellites orbiting hundreds of kilometres above the Earth. As they pass overhead sunlight hits the Earth’s surface, interacting with vegetation, soils, minerals and water. The surface reflects light back to the sensor, which splits it into hundreds of narrow wavelength bands.
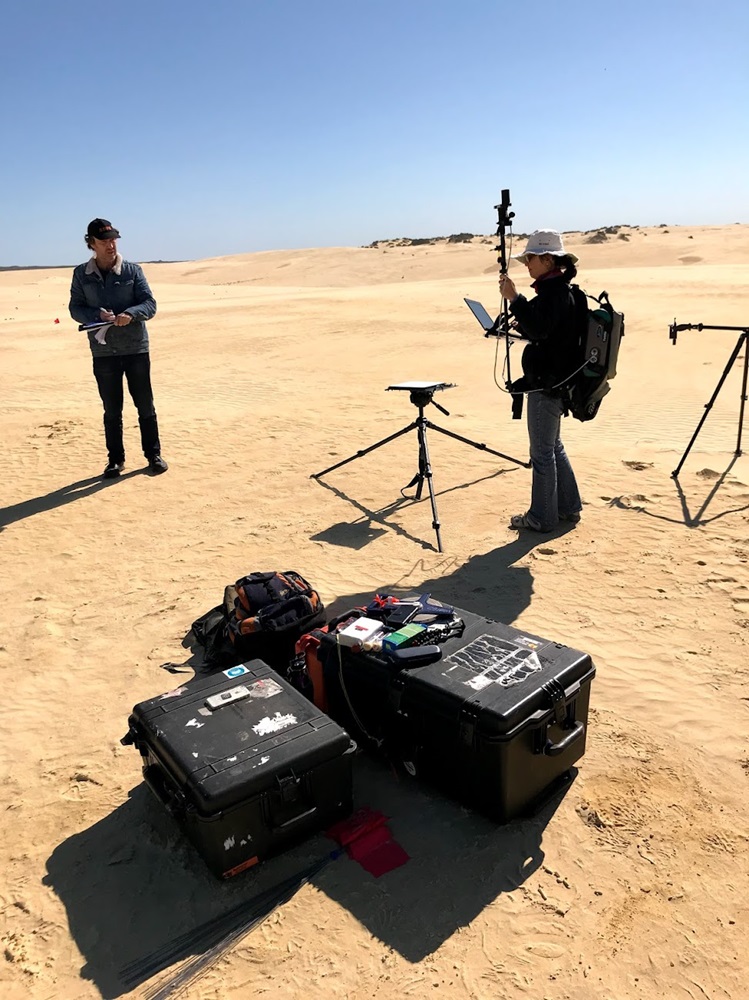
This raw data is calibrated and corrected, removing distorting effects from atmospheric interference like clouds and smoke. Our team of hyperspectral data specialists are then able to turn this data into maps using algorithms trained to recognise spectral signatures of interest.
While aircraft and drones can also carry hyperspectral sensors, satellites offer consistent, repeatable coverage that is especially valuable for a continent as large and sparsely populated as Australia.
Australia is rapidly scaling its Earth‑observation capabilities. National agencies, including CSIRO and Geoscience Australia, have contributed to sensor design, calibration and validation, data processing and research aimed at turning these massive datasets into decision‑ready information. In mineral exploration, this information can help target new ore deposits by identifying alterations in the land which may be associated with various metals of interest.
What’s the hype around hyperspectral data?
Hyperspectral data is powerful because it can differentiate look‑alike materials. For example, plants with similar colours, or minerals with similar compositions, can be distinguished by their spectral 'fingerprints' or signature.
When applied, hyperspectral sensing adds nuance, accuracy and depth to our understanding of Australia’s landscapes.
For agriculture and environmental monitoring, it can detect subtle change early. For example, stress in crops or early algal blooms in waterways can be identified before they’re visible to the naked eye. This allows famers and environmental managers to have precise, actionable insights to make better and timely decisions about when to intervene and how to use resources more efficiently.
Responsible use of data
Hyperspectral data is powerful, but it isn’t magic.
Cloud cover, smoke, deep shadows can limit data quality. That’s why good calibration and field validation is essential.
Also, to build a reliable picture, multiple observations over time are often needed through varying seasons.
Understanding these limitations helps ensure the technology is used appropriately and transparently.
As hyperspectral data becomes more accessible through space agencies, it is moving from research use into routine environmental, agricultural and resource management workflows by commercial suppliers. That shift promises to improve national resilience, sustainability and competitiveness.
Seeing the unseen
Australia’s landscapes are vast, diverse and often remote. Understanding what’s happening across them in real time has always been a challenge. But a new generation of Earth‑observation technology is giving scientists, farmers, environmental managers and industry a clearer view than ever before.
Hyperspectral satellites don’t just take pictures. They measure more than 200 narrow wavelengths of light reflected from the Earth’s surface, revealing chemical and physical details that the human eye, and even regular satellite images, can’t detect. The result is a ‘spectral signature’ for everything from soils and rocks to crops, waterways and reefs.
So, how is hyperspectral data captured, what does it show and how is it helping Australia care for our country, grow food more sustainably and explore mineral resources responsibly?
What is hyperspectral sensing?
Every material on Earth interacts with sunlight in a slightly different way. When light hits the ground, some wavelengths are absorbed and others are reflected.
Hyperspectral sensors measure these reflected wavelengths in dozens or even hundreds of extremely narrow bands.
One way to understand this advance in satellite sensing is to imagine earlier multi-spectral imaging as like listening to 14 notes on a piano whereas hyperspectral sensing is like hearing the full orchestra! That extra detail lets analysts identify materials based on their spectral ‘signature’ — a unique pattern of composition and chemistry encoded in the reflected light.
Plants, minerals, soil types, algae, pollutants, water quality indicators all have distinct spectral characteristics. Hyperspectral imagery makes those differences visible.
Collecting hyperspectral data
Most hyperspectral data come from satellites orbiting hundreds of kilometres above the Earth. As they pass overhead sunlight hits the Earth’s surface, interacting with vegetation, soils, minerals and water. The surface reflects light back to the sensor, which splits it into hundreds of narrow wavelength bands.
This raw data is calibrated and corrected, removing distorting effects from atmospheric interference like clouds and smoke. Our team of hyperspectral data specialists are then able to turn this data into maps using algorithms trained to recognise spectral signatures of interest.
While aircraft and drones can also carry hyperspectral sensors, satellites offer consistent, repeatable coverage that is especially valuable for a continent as large and sparsely populated as Australia.
Australia is rapidly scaling its Earth‑observation capabilities. National agencies, including CSIRO and Geoscience Australia, have contributed to sensor design, calibration and validation, data processing and research aimed at turning these massive datasets into decision‑ready information. In mineral exploration, this information can help target new ore deposits by identifying alterations in the land which may be associated with various metals of interest.
What’s the hype around hyperspectral data?
Hyperspectral data is powerful because it can differentiate look‑alike materials. For example, plants with similar colours, or minerals with similar compositions, can be distinguished by their spectral 'fingerprints' or signature.
When applied, hyperspectral sensing adds nuance, accuracy and depth to our understanding of Australia’s landscapes.
For agriculture and environmental monitoring, it can detect subtle change early. For example, stress in crops or early algal blooms in waterways can be identified before they’re visible to the naked eye. This allows famers and environmental managers to have precise, actionable insights to make better and timely decisions about when to intervene and how to use resources more efficiently.
Responsible use of data
Hyperspectral data is powerful, but it isn’t magic.
Cloud cover, smoke, deep shadows can limit data quality. That’s why good calibration and field validation is essential.
Also, to build a reliable picture, multiple observations over time are often needed through varying seasons.
Understanding these limitations helps ensure the technology is used appropriately and transparently.
As hyperspectral data becomes more accessible through space agencies, it is moving from research use into routine environmental, agricultural and resource management workflows by commercial suppliers. That shift promises to improve national resilience, sustainability and competitiveness.