Temperature
- Australia, on average, has warmed by 1.51 ± 0.23 °C since national records began in 1910. There has been an increase in extreme heat events associated with the warming.
Australia, on average, has warmed by 1.51 ± 0.23 °C since national records began in 1910, with most warming occurring since 1950. Every decade since 1950 has been warmer than preceding decades. The warming in Australia is consistent with global trends, with the degree of warming similar to the overall average across the world’s land areas.
Australia’s warmest year on record was 2019, and 8 of the 9 warmest years on record have occurred since 2013. The long-term warming trend means that most years are now warmer than almost any observed during the 20th century. 2021 and 2022 were less warm than most of the preceding decade, reflecting the cooling that typically occurs during La Niña years, but were still warmer than most years prior to 2000.
![Bar chart of the number of days each year with extreme daily mean temperatures between 1910 and 2023. For a full description of this figure please contact: helpdesk.climate@bom.gov.au]](/-/media/Environment/SOTC-2024/Figures/SotC24_T-01_v01.png?mw=319) Warming is observed across Australia in all months with both day- and night‑time temperatures increasing. This shift is accompanied by an increased number of extreme heat events across all months, including a greater frequency of very hot days in summer. In the record warm year of 2019 there were 40 days with extremely high nationally-averaged mean temperatures (those in the warmest 1% of days for each month), about 3 times more extreme heat days than any year prior to 2000. Also in 2019, there were 33 days when national daily average maximum temperatures exceeded 39 °C, a larger number than seen in the 59 years from 1960 to 2018 combined.
Warming is observed across Australia in all months with both day- and night‑time temperatures increasing. This shift is accompanied by an increased number of extreme heat events across all months, including a greater frequency of very hot days in summer. In the record warm year of 2019 there were 40 days with extremely high nationally-averaged mean temperatures (those in the warmest 1% of days for each month), about 3 times more extreme heat days than any year prior to 2000. Also in 2019, there were 33 days when national daily average maximum temperatures exceeded 39 °C, a larger number than seen in the 59 years from 1960 to 2018 combined.
There were fewer extremes in the period from 2020 to 2023, which was dominated by La Niña conditions, although the number of extreme heat days in those years (except 2022) was still high compared with most years prior to 2000. Extreme heat has caused more deaths in Australia than any other natural hazard and has major impacts on ecosystems and infrastructure.
The very high monthly maximum temperatures that were recorded under 2% of the time in 1960−1989, are occurring 11% of the time in 2009−2023. That is about 6 times as often. Similarly, the very high night time temperatures, which are also a major contributor to heat stress, and occurred 2% of the time in 1960−1989, now occur about 10% of the time – 5 times as often.
The occurrence of very cold days and nights has declined across Australia. An exception is for extremely cold nights in parts of south-east and south‑west Australia, where the frequency of frost in these parts has been relatively unchanged since the 1980s. In this region, there has been significant cool season drying, and hence more clear winter nights. This results in colder nights due to increased heat loss from the ground
Changes in weather systems and climate influences
Australia’s weather systems are changing. Southern Australia receives much of its rainfall during the cooler months of the year from low-pressure systems and cold fronts to the south of the subtropical high-pressure ridge. During recent decades, these systems have become less common over southern Australia, and are less likely to produce rainfall when they do occur, contributing to declines in cool season rainfall. Mean sea level atmospheric pressure is increasing over Australia, and there has been an increase in the number of high-pressure systems over southern Australia, which bring dry, clear weather and little rainfall. This increase in atmospheric pressure across southern latitudes is a response to climate change.
There is large variability in the frequency of individual weather systems between individual months and years. Many of these trends are consistent with simulations from climate models, which demonstrate that increased greenhouse gas levels lead to fewer low-pressure systems in southern Australia and a stronger subtropical ridge, but an increase in the intensity of heavy rainfall, including from thunderstorms.
Australia’s climate is also influenced from year to year by various broadscale climate influences, such as the El Niño-Southern Oscillation (ENSO), the Indian Ocean Dipole (IOD) and the Southern Annular Mode (SAM). SAM shows a sustained trend towards more positive conditions from 1950 to the present day, particularly in summer. The level of ENSO activity over the past 50 years is higher, with more significant El Niño and La Niña events than in the years between 1920 and 1970. However, there is no clear indication that recent activity levels are outside the long-term range of variability, with evidence of high levels of ENSO activity in the late 19th and early 20th centuries. There is low confidence in the long-term trends in the IOD, particularly prior to the 1960s, although paleoclimate data indicate that the recent frequency of strong positive IOD events is high in the context of multi-century variability.
Australian temperatures and global warming
Australian temperatures have warmed by 1.51 °C from 1910 to 2023. An increase of 1.5 °C is a threshold that is widely referenced in global climate change assessments, and it is important to understand how the values being reported here for Australia relate to broader global warming levels.
The Paris Agreement commits signatories to pursue efforts to limit the increase in the global average temperature to 1.5 °C above pre‑industrial levels. The Agreement does not define how this is measured, but the Intergovernmental Panel on Climate Change (IPCC) in their Sixth Assessment Report defines the time of crossing a given warming level based on the first period when the 20-year average crosses that level.
The first individual months with global temperatures above the 1.5 °C threshold occurred during the 2015–2016 El Niño. 2023 was the world’s warmest year since instrumental records began, with global temperatures 1.45 °C above the 1850–1900 average. In most major data sets, global temperatures averaged over the 12-month period from June 2023 to May 2024 were more than 1.5 °C above the pre-industrial level. Individual months or years above the threshold, however, do not mean that the threshold has yet been crossed on a sustained basis.
Over most of the world, land areas are warming faster than the ocean. This is also the case for Australia, where land areas are warming about 40% faster than the surrounding oceans. The observed rate of warming in Australia is very close to the global average for land areas, while the rate of warming for sea surface temperatures in the Australian region also closely matches the global average for oceans. Evidence available from the 19th century, which is more limited than after 1910, indicates that Australian land temperatures warmed by 1.6 ± 0.2 °C from 1850−1900 to 2011−2020. This compares to the global land average of 1.59 °C over the same period. Global temperature measurements include both land and oceans, so when a global warming level of 1.5 °C is reached, most land areas will have warmed by considerably more than 1.5 °C. In parallel, temperature extremes on land are also projected to continue to warm faster than the global average, with extreme heat days in mid‑latitudes globally expected to warm by an average of about 3 °C at 1.5 °C of global warming.
In addition to extreme heat, many other climate hazards are expected to be more significant at 2 °C or higher global warming levels than at 1.5 °C or at present-day levels. These include increased coastal inundation as a result of rising sea levels, increased heavy precipitation, increases in human health risks, water stress, and impacts on biodiversity and ecosystems on land and in the oceans.
Fire weather
- There has been an increase in extreme fire weather, and in the length of the fire season, across large parts of Australia since the 1950s. This has led to larger and more frequent fires, especially in southern Australia.
The influence of climate change on bushfires varies across Australia, depending largely on the kinds of vegetation (fuel) which grow in each region. Climate change is driving changes in temperature, rainfall, and relative humidity, all of which influence fuel availability, fuel dryness, fire weather, and ignition sources.
Fire weather (often hot, dry and windy) is a significant contributor to fire risk in forest fuel areas of southern and eastern Australia. Conversely, wetter conditions in northern and central regions results in abundant grassy fuel loads, which is a key contributing factor to fire risk in those regions.
The Forest Fire Danger Index (FFDI) is a measure of fire weather calculated from observations of temperature, rainfall, humidity, and wind speed. There has been an increase in the frequency of dangerous fire weather days (those with an FFDI above the 90th percentile) across most regions over the last 75 years, although with substantial differences between regions. These changes are particularly evident during spring and summer, and are associated with an earlier start to the southern fire weather season.
There is a notable trend in some regions of southern Australia towards more days with weather that is conducive to generating thunderstorms within smoke plumes. These fire-generated thunderstorms can lead to extremely dangerous fire behaviour, such as during the Black Summer fires (2019–2020), the Victorian Black Saturday fires (2009), and the Canberra fires (2003). New fires can be ignited from lightning strikes produced by these thunderstorms.![There has been an increase in the annual frequency of dangerous fire weather days across Australia. Spatial plot of Australia which shows the change in the number of dangerous bushfire weather days, with most areas showing an increase. For a full description of this figure please contact: helpdesk.climate@bom.gov.au]](/-/media/Environment/SOTC-2024/Figures/SotC24_FW-01_v01.png?mw=319&w=571)
Year-to-year climate variability influences how much fuel is available and its dryness. During a La Niña event, wet and cool climate anomalies are generally observed through central and south‑eastern Australia. The cooler and wetter conditions which occurred, for example, during the southern fire seasons 2020–2021, 2021–2022, and 2022–2023, mean fewer days with high FFDI values, and a reduced risk of fire in forest fuels in the south-east. Conversely, increased rainfall in inland areas leads to higher grassy fuel loads, which increases risk of fire in those regions when the vegetation dries. High rainfall in 2022 and early 2023 across northern Australia resulted in high fuel loads in spinifex and savanna regions and made 2023 one of Australia’s most extensive bushfire seasons in terms of area burned. In the interior of Australia, parts of which have seen relatively little change in FFDI, changes in fuel availability are a major driver of changes in fire risk with fire weather being less significant as a risk factor than in the east and south.
The type and amount of fuel in a region is strongly associated with the local climate. Changes in climate can change a region’s susceptibility to fire by increasing the amount of fuel (stimulating vegetation growth), by making fuel more available (through drying), or by changing the dominant vegetation type. As the climate has changed, so has the distribution of Australia’s ecosystems which in turn has altered the distribution of areas prone to dangerous fire conditions.
Lightning that occurs without significant rainfall (known as ‘dry lightning’) is a major source of natural ignition for bushfires. Understanding changes to bushfire ignition in Australia, including the frequency of dry lightning, is a current area of active research.
Rainfall
- In the south-west of Australia, there has been a decline of around 16% in April to October (cool season) rainfall since 1970. Across the same region, May to July rainfall has seen the largest decrease, of around 20% since 1970.
- In the south-east of Australia, there has been a decrease of around 9% in April to October rainfall since 1994.
- October to April (wet season) rainfall in northern Australia has increased by around 20% since 1994.
![Rainfall during April to October has been very low over parts of southern Australia in recent decades. Spatial plot of Australia which shows April to October rainfall deciles for the last 30 years (1994–2023) compared to all years from 1900 to 1993, with most areas showing below average rainfall. For a full description of this figure please contact: helpdesk.climate@bom.gov.au]](/-/media/Environment/SOTC-2024/Figures/SotC24_R-01_v01.png?mw=319&w=528.5)
Australian rainfall is highly variable and is strongly influenced by seasonal climate influences such as El Niño, La Niña, the Indian Ocean Dipole (IOD) and the Southern Annular Mode (SAM). Despite this natural variability, long-term trends are evident in Australia’s rainfall records. There has been a shift towards drier conditions across the south-west and south-east of Australia, with more frequent periods of below-average rainfall, especially for the cool season months from April to October. Cool season rainfall in southern Australia has been above the 1961–1990 average in only 6 of the 30 years from 1994−2023, a 30-year period which includes the Millennium Drought (1997−2009). This is due to a combination of natural variability on decadal timescales and changes in large‑scale circulation largely driven by an increase in greenhouse gas emissions. Cool season rainfall is particularly important for southern Australia, as it is the main growing season for many crops. It is when peak streamflow occurs in most catchments in the region, as cool season rainfall is generally more effective than warm‑season rainfall in generating runoff, and is also when groundwater recharge is most likely to occur.
![A combined figure that shows Left: Rainfall varies from year to year, but in the south-west of Australia, April to October rainfall has decreased due to climate change from the 1960s onwards. Bar chart which shows anomalies of April to October rainfall from 1880 to 2023 for south-western Australia (southwest of the line joining the points 30° S, 115° E and 35° S, 120° E), with respect to 1961 to 1990 average. Right: April to October rainfall in the south-east of the country has been declining for the past two decades. There are fewer wet years now than during the 20th century. Bar chart which shows anomalies of April to October rainfall from 1880 to 2023 for south-eastern Australia (south of 33° S, east of 135° E inclusive), with respect to 1961 to 1990 average.For a full description of this figure please contact: helpdesk.climate@bom.gov.au]](/-/media/Environment/SOTC-2024/Figures/SotC24R02R03v0101.png?mw=800)
The drying trend in southern Australia is most evident in the south-west and south-east of the country. The recent drying across these regions is the most sustained large-scale change in observed rainfall since widespread observations became available in the late 1880s. The trend is particularly strong for the period from May to July, in the earlier part of the cool season, over south‑west Western Australia, with average rainfall since 1970 around 20% less than the average from 1900 to 1969. Over the full cool season from April to October, the decline in rainfall over the same period is around 16%. In the last 30 years since 1994, the decline in May to July has further strengthened to around 24%, despite relatively high cool season rainfall during 2021. It is highly unlikely that a decline of this magnitude could have occurred due to natural variability alone.
![Spatial plot of Australia which shows Northern wet season (October–April) rainfall deciles for the past 30 years (1994-2024) compared with all years from 1900 to 1993, with the western two-thirds of northern Australia showing above average rainfall. For a full description of this figure please contact: helpdesk.climate@bom.gov.au]](/-/media/Environment/SOTC-2024/Figures/SotC24_R-04_v01.png?mw=319)
![Bar chart which shows anomalies of October to April rainfall for northern Australia from 1900 to 2023, calculated with respect to the 1961 to 1990 average. For a full description of this figure please contact: helpdesk.climate@bom.gov.au]](/-/media/Environment/SOTC-2024/Figures/SotC24_R-05_v01.png?mw=319)
Since 1994, average cool season rainfall in the south-east has been around 9% lower than it was in the 1900–1993 period. The Millennium Drought was a major influence on this, affecting rainfall totals across the region from 1997–2009. However, cool season rainfall has remained below average after the Millennium Drought, with mean rainfall during 2010–2023 remaining 5% below the 1900–1993 average. In the years since 2010 cool season rainfall above the 1961–1990 average has only been recorded for south-eastern Australia in 4 out of 14 years, during the La Niña events of 2010–2012 and 2020–2022 and the strong negative IOD event of 2016. The declining trend in rainfall is associated with a trend towards higher surface atmospheric pressure in the region and a shift in large-scale weather patterns-more highs, fewer lows and a reduction in the number of rain‑producing lows and cold fronts.
Conversely, northern Australia has been wetter than average over the last 30 years across all seasons, especially in the north-west during the northern wet season from October to April. Since 1994, wet season rainfall in northern Australia (from 26 °S, the latitude of the South Australia-Northern Territory border, northwards) has been 20% above the 1900–1993 average.
Seven of the 10 wettest northern Australia wet seasons have occurred since 1998, including during the recent La Niña periods 1998–2001, 2010–2011, and 2022–2023. Rainfall variability remains high, however, with rainfall during the last decade being closer to the long‑term average than in the previous 2 decades. In parts of eastern Queensland south of the tropics, there has been a trend towards lower rainfall throughout the year, particularly during the past decade.
Warm season rainfall has been below average in parts of Tasmania, and the south-east and south-west coasts of mainland Australia in recent decades.
Heavy rainfall
- Heavy rainfall events are becoming more intense.
Observations show an increase in the intensity of heavy rainfall events in Australia. The intensity of short-duration extreme rainfall events has increased by around 10% or more in some regions and in recent decades, with the largest increases typically observed in the north of the country. Short-duration extreme rainfall events (such as high hourly total rainfalls) are often associated with flash flooding, which brings increased risk to communities. This is particularly the case in urban environments, where the prevalence of impervious ground cover (e.g. concrete) leads to increased flooding during heavy downpours.
Heavy short-term rainfall events are usually caused by weather systems such as thunderstorms, tropical cyclones, and monsoon and east coast lows. Widespread heavy rainfall at a range of timescales can also be linked to other types of systems, including extratropical lows and fronts.
Daily rainfall totals associated with thunderstorms have increased since 1979, particularly in northern Australia. This is primarily due to an increase in the intensity of rainfall per storm. Conversely, the number of low-pressure systems that can bring sustained heavy rainfall to highly populated parts of southern Australia has declined in recent decades. This has implications for recharging surface water storages and groundwater, and water resource management.
Heavy rainfall, climate change and flood risk
The intensity of heavy rainfall events in Australia is increasing as the climate warms. Warmer air can hold more water vapour than cooler air, and moisture in the atmosphere can increase by 7% per degree of warming, all other things being equal. This can cause an increased likelihood of heavy rainfall events, even in areas where average rainfall is likely to decrease such as some regions of southern Australia.
Observational data indicate that daily rainfall extremes that happen once per year or less often are likely to intensify by an average of about 8% for each degree of global warming, although this varies with region. Hourly extreme rainfall is also likely to increase by around 15% per degree of warming, well above the 7% that would arise from increased moisture content in a warmer atmosphere alone.
While the role of climate change in recent extreme heat in Australia is very well established, attributing individual heavy rainfall events to climate change is more challenging. Interannual variability in heavy rainfall in Australia is high compared with most other parts of the world, which is linked to major climate influences including La Niña and the Indian Ocean Dipole (IOD). A potential increase in rainfall intensity of 10% relative to pre-industrial climate is small relative to the typical difference in heavy rainfall between El Niño and La Niña years in much of Australia, making any potential climate change signal difficult to detect in observations of any individual event.
Climate model simulations project that heavy rainfall events will further intensify during the 21st century, with the rate of intensification proportional to the rate of global warming. Changes in heavy rainfall in particular locations are also influenced by changes in weather systems, such as east coast lows and tropical cyclones, both of which are expected to become less frequent. This may lead to some regions experiencing trends in heavy rainfall that differ from typical values at the national or global scale, particularly for rainfall events that occur multiple times per year as opposed to rarer events. Increased atmospheric moisture can also provide more energy for some processes, such as enhanced updrafts in thunderstorms, that generate heavy rainfall events, which can further increase the intensity of heavy rainfall due to global warming. In addition, although widespread heavy rainfall typically occurs when very high atmospheric moisture coincides with unusually severe or persistent synoptic systems, localised heavy rainfall from thunderstorms may not as be well simulated by climate models as larger-scale systems are.
Climate change may also affect the drivers of, and processes involved in, multi-day rainfall extremes. These include atmospheric rivers which are responsible for the transport of large quantities of moisture, the behaviour of El Niño and La Niña, and persistent blocking highs (strong high-pressure systems that remain almost stationary for an extended period of time, blocking the eastward progression of weather systems across southern Australia) in the Tasman Sea. The details of these effects are subject to ongoing research.
Heavy rainfall is one of the major drivers of flood risk, which is one of the major natural hazards facing Australia. Multiple factors contribute to flood risk. The most important weather-related factors include how extreme a rainfall event is and how wet catchments are prior to the rain event. In estuarine and coastal environments, tides and sea levels can also be important. Flood risk can also change over time as a result of changes in land use and land cover, and through changes in the extent to which streams in the catchment area are regulated. Flood risk is influenced by rainfall at a range of timescales, depending on the catchment. Flash flooding is driven by intense rainfall in localised regions on timescales of minutes to hours, while flooding in larger catchments responds to rainfall on timescales of days to weeks.
Sustained heavy rainfall and associated flooding in much of Australia, particularly the east, is most common during La Niña, as illustrated by the multiple floods that occurred in eastern Australia in 2022. The 11 wettest years on record in eastern Australia were all influenced by La Niña, and many of eastern Australia’s most significant flood years, such as 1974, 2010−2011 and 2021–2022, have occurred during strong La Niña events, although significant flooding can sometimes occur in non-La Niña years. For a given flow level, larger floods occur when soil moisture levels are high. The impact of multiple flood events is particularly pronounced when La Niña events occur in multiple successive years, as occurred in 2020–2022, and previously in periods such as 1954–1956 and 1973–1976.
Streamflow
- More than 28% of hydrologic reference stations around Australia show significant decreases in streamflow since 1970 while only 4% of gauges have shown significant increases.
- The significant decreases in streamflow are concentrated in southern Australia, while the increases are almost all in the north.
The observed long-term reduction in rainfall across many parts of southern Australia has led to reduced streamflow, although with considerable interannual variability. More than 28% of Australia’s Hydrologic Reference Stations (HRS) gauges show a significantly declining trend in annual median streamflow since 1970. HRS are gauges in catchments with little disturbance from human activities and with at least a 30-year record, and are an indicator of long-term impacts from climate change on streamflow. Across the HRS gauges, the drainage divisions with the highest proportion of stations with significant declines are Tasmania (19 out of 25), South West Coast (30 out of 50), Murray-Darling Basin (40 out of 129), South Australian Gulf (4 out of 7) and South East Coast (VIC) (19 out of 66). With the exception of 2 gauges in the South West Coast division, no other gauge in these 5 drainage divisions show any increasing trend.
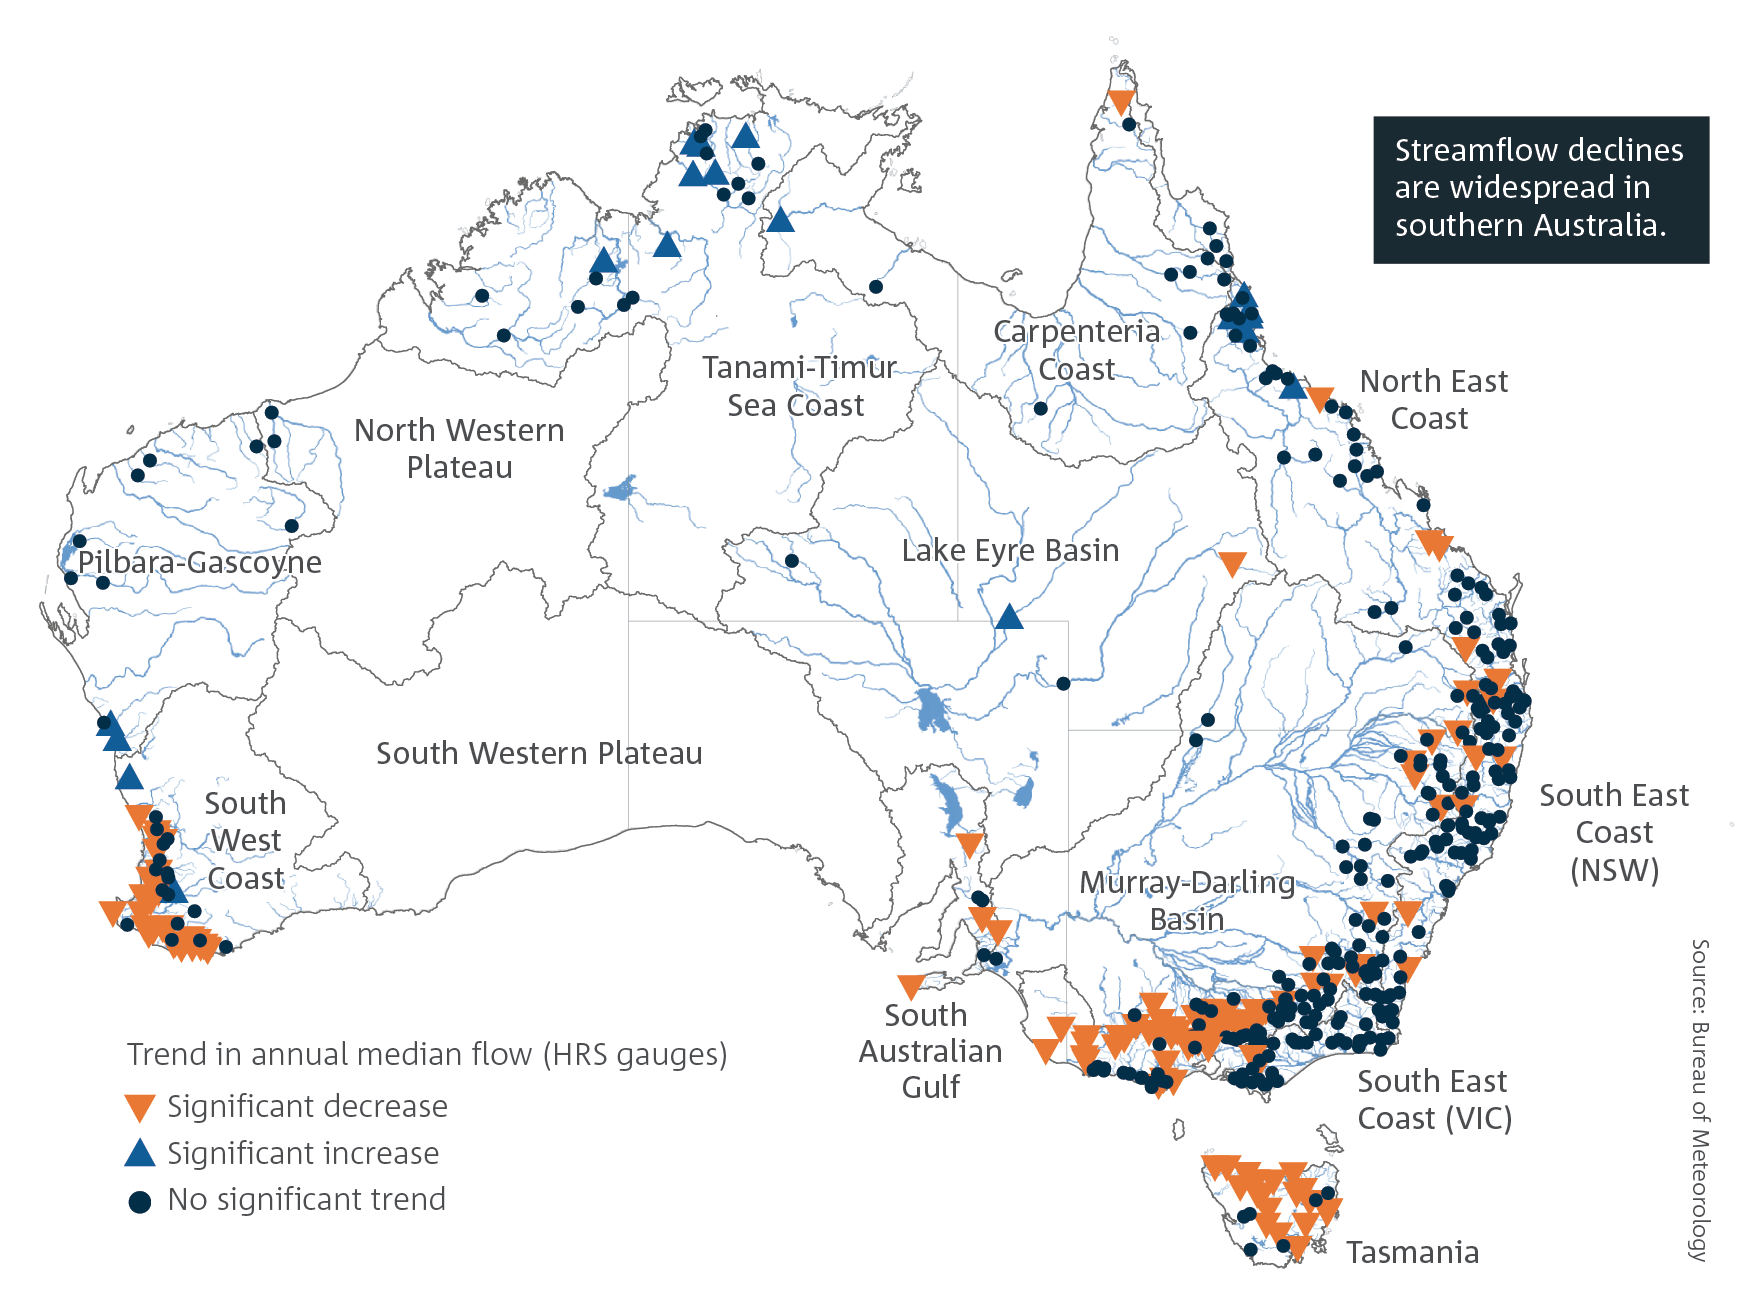 Significant increases in streamflow have been observed at only 4% of the 459 assessed gauges. Increases are almost exclusively in the northern half of the country, in the Tanami-Timor Sea Coast, North East Coast, Carpentaria Coast and Pilbara-Gascoyne drainage divisions where wet season rainfall has generally increased. The North East Coast drainage division exhibits mixed trends, with increases in the north and decreases in the south. Increases in the other northern Australian divisions are prominent and no gauges show significant declines.
Nearly one third of the HRS gauges in the Murray-Darling Basin show significantly declining streamflow trends, with the highest proportion in the southern Basin including the Avoca, Broken, Campaspe, Loddon, Wimmera and Goulburn catchments. In the northern Basin, the Border Rivers, Namoi and Gwydir catchments have the highest number of gauges with significant declines.
Declining trends are also observed in the magnitude of annual high and low flows, with more reductions observed in high flows, and reduced flow duration including fewer days with high flows. In more than half of the gauges in the Murray-Darling Basin, North East Coast, South Australian Gulf, South East Coast (VIC), South West Coast and Tasmania divisions, the number of days at or above high flow thresholds has been reduced. At gauges in the Tasmania, South Australian Gulf and South East Coast (VIC) divisions, low flow days have increased and high flow days have decreased, which indicates a general reduction of water availability in the streams at those locations.
Tropical cyclones
- There has been a decrease in the number of tropical cyclones observed in the Australian region since at least 1982.
Tropical cyclone activity in the Australian region varies substantially from year to year. This is partially due to the influence of large-scale climate drivers: the number of cyclones in our region generally declines with El Niño and increases with La Niña. Intense tropical cyclones can cause serious impacts associated with catastrophic winds, storm surges and heavy rainfall and flooding.
There has been a downward trend in the number of tropical cyclones observed in the Australian region since reliable satellite observations began in 1982. Additional non-satellite observations suggest there has also been a longer-term reduction in the number of tropical cyclones since 1900.
The trend in cyclone intensity in the Australian region is harder to quantify than cyclone frequency, due to uncertainties in estimating the intensity of individual cyclones and the relatively small number of intense cyclones.
Snowfall
- Maximum snow depth, snow cover and number of snow days have decreased in Australian alpine regions since the late 1950s.
Downward trends in maximum snow depth have been observed for Australian alpine regions since the late 1950s, with the largest declines during spring and at lower altitudes. Downward trends in the temporal and spatial extent of snow cover have also been observed. The number of snowfall days has also decreased. Years with persistent deep snow cover have become rare.
Snow depth is closely related to temperature, and the observed declines are associated with global warming trends. Decreasing trends in snow depth are greater in the late-season month of September than during winter. Maximum snow depth remains highly variable and is strongly influenced by rare heavy snowfall days, which have no observed trends in frequency.
Temperature
- Australia, on average, has warmed by 1.51 ± 0.23 °C since national records began in 1910. There has been an increase in extreme heat events associated with the warming.
Australia, on average, has warmed by 1.51 ± 0.23 °C since national records began in 1910, with most warming occurring since 1950. Every decade since 1950 has been warmer than preceding decades. The warming in Australia is consistent with global trends, with the degree of warming similar to the overall average across the world’s land areas.
Australia’s warmest year on record was 2019, and 8 of the 9 warmest years on record have occurred since 2013. The long-term warming trend means that most years are now warmer than almost any observed during the 20th century. 2021 and 2022 were less warm than most of the preceding decade, reflecting the cooling that typically occurs during La Niña years, but were still warmer than most years prior to 2000.
Warming is observed across Australia in all months with both day- and night‑time temperatures increasing. This shift is accompanied by an increased number of extreme heat events across all months, including a greater frequency of very hot days in summer. In the record warm year of 2019 there were 40 days with extremely high nationally-averaged mean temperatures (those in the warmest 1% of days for each month), about 3 times more extreme heat days than any year prior to 2000. Also in 2019, there were 33 days when national daily average maximum temperatures exceeded 39 °C, a larger number than seen in the 59 years from 1960 to 2018 combined.
There were fewer extremes in the period from 2020 to 2023, which was dominated by La Niña conditions, although the number of extreme heat days in those years (except 2022) was still high compared with most years prior to 2000. Extreme heat has caused more deaths in Australia than any other natural hazard and has major impacts on ecosystems and infrastructure.
The very high monthly maximum temperatures that were recorded under 2% of the time in 1960−1989, are occurring 11% of the time in 2009−2023. That is about 6 times as often. Similarly, the very high night time temperatures, which are also a major contributor to heat stress, and occurred 2% of the time in 1960−1989, now occur about 10% of the time – 5 times as often.
The occurrence of very cold days and nights has declined across Australia. An exception is for extremely cold nights in parts of south-east and south‑west Australia, where the frequency of frost in these parts has been relatively unchanged since the 1980s. In this region, there has been significant cool season drying, and hence more clear winter nights. This results in colder nights due to increased heat loss from the ground
Changes in weather systems and climate influences
Australia’s weather systems are changing. Southern Australia receives much of its rainfall during the cooler months of the year from low-pressure systems and cold fronts to the south of the subtropical high-pressure ridge. During recent decades, these systems have become less common over southern Australia, and are less likely to produce rainfall when they do occur, contributing to declines in cool season rainfall. Mean sea level atmospheric pressure is increasing over Australia, and there has been an increase in the number of high-pressure systems over southern Australia, which bring dry, clear weather and little rainfall. This increase in atmospheric pressure across southern latitudes is a response to climate change.
There is large variability in the frequency of individual weather systems between individual months and years. Many of these trends are consistent with simulations from climate models, which demonstrate that increased greenhouse gas levels lead to fewer low-pressure systems in southern Australia and a stronger subtropical ridge, but an increase in the intensity of heavy rainfall, including from thunderstorms.
Australia’s climate is also influenced from year to year by various broadscale climate influences, such as the El Niño-Southern Oscillation (ENSO), the Indian Ocean Dipole (IOD) and the Southern Annular Mode (SAM). SAM shows a sustained trend towards more positive conditions from 1950 to the present day, particularly in summer. The level of ENSO activity over the past 50 years is higher, with more significant El Niño and La Niña events than in the years between 1920 and 1970. However, there is no clear indication that recent activity levels are outside the long-term range of variability, with evidence of high levels of ENSO activity in the late 19th and early 20th centuries. There is low confidence in the long-term trends in the IOD, particularly prior to the 1960s, although paleoclimate data indicate that the recent frequency of strong positive IOD events is high in the context of multi-century variability.
Australian temperatures and global warming
Australian temperatures have warmed by 1.51 °C from 1910 to 2023. An increase of 1.5 °C is a threshold that is widely referenced in global climate change assessments, and it is important to understand how the values being reported here for Australia relate to broader global warming levels.
The Paris Agreement commits signatories to pursue efforts to limit the increase in the global average temperature to 1.5 °C above pre‑industrial levels. The Agreement does not define how this is measured, but the Intergovernmental Panel on Climate Change (IPCC) in their Sixth Assessment Report defines the time of crossing a given warming level based on the first period when the 20-year average crosses that level.
The first individual months with global temperatures above the 1.5 °C threshold occurred during the 2015–2016 El Niño. 2023 was the world’s warmest year since instrumental records began, with global temperatures 1.45 °C above the 1850–1900 average. In most major data sets, global temperatures averaged over the 12-month period from June 2023 to May 2024 were more than 1.5 °C above the pre-industrial level. Individual months or years above the threshold, however, do not mean that the threshold has yet been crossed on a sustained basis.
Over most of the world, land areas are warming faster than the ocean. This is also the case for Australia, where land areas are warming about 40% faster than the surrounding oceans. The observed rate of warming in Australia is very close to the global average for land areas, while the rate of warming for sea surface temperatures in the Australian region also closely matches the global average for oceans. Evidence available from the 19th century, which is more limited than after 1910, indicates that Australian land temperatures warmed by 1.6 ± 0.2 °C from 1850−1900 to 2011−2020. This compares to the global land average of 1.59 °C over the same period. Global temperature measurements include both land and oceans, so when a global warming level of 1.5 °C is reached, most land areas will have warmed by considerably more than 1.5 °C. In parallel, temperature extremes on land are also projected to continue to warm faster than the global average, with extreme heat days in mid‑latitudes globally expected to warm by an average of about 3 °C at 1.5 °C of global warming.
In addition to extreme heat, many other climate hazards are expected to be more significant at 2 °C or higher global warming levels than at 1.5 °C or at present-day levels. These include increased coastal inundation as a result of rising sea levels, increased heavy precipitation, increases in human health risks, water stress, and impacts on biodiversity and ecosystems on land and in the oceans.
Fire weather
- There has been an increase in extreme fire weather, and in the length of the fire season, across large parts of Australia since the 1950s. This has led to larger and more frequent fires, especially in southern Australia.
The influence of climate change on bushfires varies across Australia, depending largely on the kinds of vegetation (fuel) which grow in each region. Climate change is driving changes in temperature, rainfall, and relative humidity, all of which influence fuel availability, fuel dryness, fire weather, and ignition sources.
Fire weather (often hot, dry and windy) is a significant contributor to fire risk in forest fuel areas of southern and eastern Australia. Conversely, wetter conditions in northern and central regions results in abundant grassy fuel loads, which is a key contributing factor to fire risk in those regions.
The Forest Fire Danger Index (FFDI) is a measure of fire weather calculated from observations of temperature, rainfall, humidity, and wind speed. There has been an increase in the frequency of dangerous fire weather days (those with an FFDI above the 90th percentile) across most regions over the last 75 years, although with substantial differences between regions. These changes are particularly evident during spring and summer, and are associated with an earlier start to the southern fire weather season.
There is a notable trend in some regions of southern Australia towards more days with weather that is conducive to generating thunderstorms within smoke plumes. These fire-generated thunderstorms can lead to extremely dangerous fire behaviour, such as during the Black Summer fires (2019–2020), the Victorian Black Saturday fires (2009), and the Canberra fires (2003). New fires can be ignited from lightning strikes produced by these thunderstorms.
Year-to-year climate variability influences how much fuel is available and its dryness. During a La Niña event, wet and cool climate anomalies are generally observed through central and south‑eastern Australia. The cooler and wetter conditions which occurred, for example, during the southern fire seasons 2020–2021, 2021–2022, and 2022–2023, mean fewer days with high FFDI values, and a reduced risk of fire in forest fuels in the south-east. Conversely, increased rainfall in inland areas leads to higher grassy fuel loads, which increases risk of fire in those regions when the vegetation dries. High rainfall in 2022 and early 2023 across northern Australia resulted in high fuel loads in spinifex and savanna regions and made 2023 one of Australia’s most extensive bushfire seasons in terms of area burned. In the interior of Australia, parts of which have seen relatively little change in FFDI, changes in fuel availability are a major driver of changes in fire risk with fire weather being less significant as a risk factor than in the east and south.
The type and amount of fuel in a region is strongly associated with the local climate. Changes in climate can change a region’s susceptibility to fire by increasing the amount of fuel (stimulating vegetation growth), by making fuel more available (through drying), or by changing the dominant vegetation type. As the climate has changed, so has the distribution of Australia’s ecosystems which in turn has altered the distribution of areas prone to dangerous fire conditions.
Lightning that occurs without significant rainfall (known as ‘dry lightning’) is a major source of natural ignition for bushfires. Understanding changes to bushfire ignition in Australia, including the frequency of dry lightning, is a current area of active research.
Rainfall
- In the south-west of Australia, there has been a decline of around 16% in April to October (cool season) rainfall since 1970. Across the same region, May to July rainfall has seen the largest decrease, of around 20% since 1970.
- In the south-east of Australia, there has been a decrease of around 9% in April to October rainfall since 1994.
- October to April (wet season) rainfall in northern Australia has increased by around 20% since 1994.
Australian rainfall is highly variable and is strongly influenced by seasonal climate influences such as El Niño, La Niña, the Indian Ocean Dipole (IOD) and the Southern Annular Mode (SAM). Despite this natural variability, long-term trends are evident in Australia’s rainfall records. There has been a shift towards drier conditions across the south-west and south-east of Australia, with more frequent periods of below-average rainfall, especially for the cool season months from April to October. Cool season rainfall in southern Australia has been above the 1961–1990 average in only 6 of the 30 years from 1994−2023, a 30-year period which includes the Millennium Drought (1997−2009). This is due to a combination of natural variability on decadal timescales and changes in large‑scale circulation largely driven by an increase in greenhouse gas emissions. Cool season rainfall is particularly important for southern Australia, as it is the main growing season for many crops. It is when peak streamflow occurs in most catchments in the region, as cool season rainfall is generally more effective than warm‑season rainfall in generating runoff, and is also when groundwater recharge is most likely to occur.
The drying trend in southern Australia is most evident in the south-west and south-east of the country. The recent drying across these regions is the most sustained large-scale change in observed rainfall since widespread observations became available in the late 1880s. The trend is particularly strong for the period from May to July, in the earlier part of the cool season, over south‑west Western Australia, with average rainfall since 1970 around 20% less than the average from 1900 to 1969. Over the full cool season from April to October, the decline in rainfall over the same period is around 16%. In the last 30 years since 1994, the decline in May to July has further strengthened to around 24%, despite relatively high cool season rainfall during 2021. It is highly unlikely that a decline of this magnitude could have occurred due to natural variability alone.
Since 1994, average cool season rainfall in the south-east has been around 9% lower than it was in the 1900–1993 period. The Millennium Drought was a major influence on this, affecting rainfall totals across the region from 1997–2009. However, cool season rainfall has remained below average after the Millennium Drought, with mean rainfall during 2010–2023 remaining 5% below the 1900–1993 average. In the years since 2010 cool season rainfall above the 1961–1990 average has only been recorded for south-eastern Australia in 4 out of 14 years, during the La Niña events of 2010–2012 and 2020–2022 and the strong negative IOD event of 2016. The declining trend in rainfall is associated with a trend towards higher surface atmospheric pressure in the region and a shift in large-scale weather patterns-more highs, fewer lows and a reduction in the number of rain‑producing lows and cold fronts.
Conversely, northern Australia has been wetter than average over the last 30 years across all seasons, especially in the north-west during the northern wet season from October to April. Since 1994, wet season rainfall in northern Australia (from 26 °S, the latitude of the South Australia-Northern Territory border, northwards) has been 20% above the 1900–1993 average.
Seven of the 10 wettest northern Australia wet seasons have occurred since 1998, including during the recent La Niña periods 1998–2001, 2010–2011, and 2022–2023. Rainfall variability remains high, however, with rainfall during the last decade being closer to the long‑term average than in the previous 2 decades. In parts of eastern Queensland south of the tropics, there has been a trend towards lower rainfall throughout the year, particularly during the past decade.
Warm season rainfall has been below average in parts of Tasmania, and the south-east and south-west coasts of mainland Australia in recent decades.
Heavy rainfall
- Heavy rainfall events are becoming more intense.
Observations show an increase in the intensity of heavy rainfall events in Australia. The intensity of short-duration extreme rainfall events has increased by around 10% or more in some regions and in recent decades, with the largest increases typically observed in the north of the country. Short-duration extreme rainfall events (such as high hourly total rainfalls) are often associated with flash flooding, which brings increased risk to communities. This is particularly the case in urban environments, where the prevalence of impervious ground cover (e.g. concrete) leads to increased flooding during heavy downpours.
Heavy short-term rainfall events are usually caused by weather systems such as thunderstorms, tropical cyclones, and monsoon and east coast lows. Widespread heavy rainfall at a range of timescales can also be linked to other types of systems, including extratropical lows and fronts.
Daily rainfall totals associated with thunderstorms have increased since 1979, particularly in northern Australia. This is primarily due to an increase in the intensity of rainfall per storm. Conversely, the number of low-pressure systems that can bring sustained heavy rainfall to highly populated parts of southern Australia has declined in recent decades. This has implications for recharging surface water storages and groundwater, and water resource management.
Heavy rainfall, climate change and flood risk
The intensity of heavy rainfall events in Australia is increasing as the climate warms. Warmer air can hold more water vapour than cooler air, and moisture in the atmosphere can increase by 7% per degree of warming, all other things being equal. This can cause an increased likelihood of heavy rainfall events, even in areas where average rainfall is likely to decrease such as some regions of southern Australia.
Observational data indicate that daily rainfall extremes that happen once per year or less often are likely to intensify by an average of about 8% for each degree of global warming, although this varies with region. Hourly extreme rainfall is also likely to increase by around 15% per degree of warming, well above the 7% that would arise from increased moisture content in a warmer atmosphere alone.
While the role of climate change in recent extreme heat in Australia is very well established, attributing individual heavy rainfall events to climate change is more challenging. Interannual variability in heavy rainfall in Australia is high compared with most other parts of the world, which is linked to major climate influences including La Niña and the Indian Ocean Dipole (IOD). A potential increase in rainfall intensity of 10% relative to pre-industrial climate is small relative to the typical difference in heavy rainfall between El Niño and La Niña years in much of Australia, making any potential climate change signal difficult to detect in observations of any individual event.
Climate model simulations project that heavy rainfall events will further intensify during the 21st century, with the rate of intensification proportional to the rate of global warming. Changes in heavy rainfall in particular locations are also influenced by changes in weather systems, such as east coast lows and tropical cyclones, both of which are expected to become less frequent. This may lead to some regions experiencing trends in heavy rainfall that differ from typical values at the national or global scale, particularly for rainfall events that occur multiple times per year as opposed to rarer events. Increased atmospheric moisture can also provide more energy for some processes, such as enhanced updrafts in thunderstorms, that generate heavy rainfall events, which can further increase the intensity of heavy rainfall due to global warming. In addition, although widespread heavy rainfall typically occurs when very high atmospheric moisture coincides with unusually severe or persistent synoptic systems, localised heavy rainfall from thunderstorms may not as be well simulated by climate models as larger-scale systems are.
Climate change may also affect the drivers of, and processes involved in, multi-day rainfall extremes. These include atmospheric rivers which are responsible for the transport of large quantities of moisture, the behaviour of El Niño and La Niña, and persistent blocking highs (strong high-pressure systems that remain almost stationary for an extended period of time, blocking the eastward progression of weather systems across southern Australia) in the Tasman Sea. The details of these effects are subject to ongoing research.
Heavy rainfall is one of the major drivers of flood risk, which is one of the major natural hazards facing Australia. Multiple factors contribute to flood risk. The most important weather-related factors include how extreme a rainfall event is and how wet catchments are prior to the rain event. In estuarine and coastal environments, tides and sea levels can also be important. Flood risk can also change over time as a result of changes in land use and land cover, and through changes in the extent to which streams in the catchment area are regulated. Flood risk is influenced by rainfall at a range of timescales, depending on the catchment. Flash flooding is driven by intense rainfall in localised regions on timescales of minutes to hours, while flooding in larger catchments responds to rainfall on timescales of days to weeks.
Sustained heavy rainfall and associated flooding in much of Australia, particularly the east, is most common during La Niña, as illustrated by the multiple floods that occurred in eastern Australia in 2022. The 11 wettest years on record in eastern Australia were all influenced by La Niña, and many of eastern Australia’s most significant flood years, such as 1974, 2010−2011 and 2021–2022, have occurred during strong La Niña events, although significant flooding can sometimes occur in non-La Niña years. For a given flow level, larger floods occur when soil moisture levels are high. The impact of multiple flood events is particularly pronounced when La Niña events occur in multiple successive years, as occurred in 2020–2022, and previously in periods such as 1954–1956 and 1973–1976.
Streamflow
- More than 28% of hydrologic reference stations around Australia show significant decreases in streamflow since 1970 while only 4% of gauges have shown significant increases.
- The significant decreases in streamflow are concentrated in southern Australia, while the increases are almost all in the north.
The observed long-term reduction in rainfall across many parts of southern Australia has led to reduced streamflow, although with considerable interannual variability. More than 28% of Australia’s Hydrologic Reference Stations (HRS) gauges show a significantly declining trend in annual median streamflow since 1970. HRS are gauges in catchments with little disturbance from human activities and with at least a 30-year record, and are an indicator of long-term impacts from climate change on streamflow. Across the HRS gauges, the drainage divisions with the highest proportion of stations with significant declines are Tasmania (19 out of 25), South West Coast (30 out of 50), Murray-Darling Basin (40 out of 129), South Australian Gulf (4 out of 7) and South East Coast (VIC) (19 out of 66). With the exception of 2 gauges in the South West Coast division, no other gauge in these 5 drainage divisions show any increasing trend.
Significant increases in streamflow have been observed at only 4% of the 459 assessed gauges. Increases are almost exclusively in the northern half of the country, in the Tanami-Timor Sea Coast, North East Coast, Carpentaria Coast and Pilbara-Gascoyne drainage divisions where wet season rainfall has generally increased. The North East Coast drainage division exhibits mixed trends, with increases in the north and decreases in the south. Increases in the other northern Australian divisions are prominent and no gauges show significant declines.
Nearly one third of the HRS gauges in the Murray-Darling Basin show significantly declining streamflow trends, with the highest proportion in the southern Basin including the Avoca, Broken, Campaspe, Loddon, Wimmera and Goulburn catchments. In the northern Basin, the Border Rivers, Namoi and Gwydir catchments have the highest number of gauges with significant declines.
Declining trends are also observed in the magnitude of annual high and low flows, with more reductions observed in high flows, and reduced flow duration including fewer days with high flows. In more than half of the gauges in the Murray-Darling Basin, North East Coast, South Australian Gulf, South East Coast (VIC), South West Coast and Tasmania divisions, the number of days at or above high flow thresholds has been reduced. At gauges in the Tasmania, South Australian Gulf and South East Coast (VIC) divisions, low flow days have increased and high flow days have decreased, which indicates a general reduction of water availability in the streams at those locations.
Tropical cyclones
- There has been a decrease in the number of tropical cyclones observed in the Australian region since at least 1982.
Tropical cyclone activity in the Australian region varies substantially from year to year. This is partially due to the influence of large-scale climate drivers: the number of cyclones in our region generally declines with El Niño and increases with La Niña. Intense tropical cyclones can cause serious impacts associated with catastrophic winds, storm surges and heavy rainfall and flooding.
There has been a downward trend in the number of tropical cyclones observed in the Australian region since reliable satellite observations began in 1982. Additional non-satellite observations suggest there has also been a longer-term reduction in the number of tropical cyclones since 1900.
The trend in cyclone intensity in the Australian region is harder to quantify than cyclone frequency, due to uncertainties in estimating the intensity of individual cyclones and the relatively small number of intense cyclones.
Snowfall
- Maximum snow depth, snow cover and number of snow days have decreased in Australian alpine regions since the late 1950s.
Downward trends in maximum snow depth have been observed for Australian alpine regions since the late 1950s, with the largest declines during spring and at lower altitudes. Downward trends in the temporal and spatial extent of snow cover have also been observed. The number of snowfall days has also decreased. Years with persistent deep snow cover have become rare.
Snow depth is closely related to temperature, and the observed declines are associated with global warming trends. Decreasing trends in snow depth are greater in the late-season month of September than during winter. Maximum snow depth remains highly variable and is strongly influenced by rare heavy snowfall days, which have no observed trends in frequency.