Greenhouse gases
- Global average concentrations of all major long-lived greenhouse gases continue to rise in the atmosphere, driving further climate change.
- The rate of CO2 accumulation in the atmosphere has increased every decade since atmospheric measurements began. Global average annual mean CO2 concentration reached 419.2 parts per million (ppm) in 2023. Adding all greenhouse gases together, concentrations reached 524 ppm of CO2-equivalent.
- Over the past 2 years, the amounts of atmospheric methane and nitrous oxide have increased rapidly.
The primary and unequivocal driver of climate change since the 1850−1900 period is the accumulation of greenhouse gases in the atmosphere. Global mean surface warming throughout the 21st century will be largely determined by cumulative emissions of carbon dioxide (CO2) and the other long-lived greenhouse gases, and what proportion of those emissions persist in the atmosphere.
Globally averaged atmospheric concentrations of all major long-lived greenhouse gases, and a group of synthetic greenhouse gases industrially produced for uses such as refrigeration, continue to rise.
![CO2 measured at Kennaook/Cape Grim has increased at an accelerating rate over the past four decades. CO2 rise (ppm) 1980–1989: 14 1990–1999: 16 2000–2009: 19 2010–2019: 23 Line chart which shows background monthly mean CO2 calculated from hourly clean-air CO2 measurements at the Kennaook/Cape Grim Baseline Air Pollution Station from 1976 through to June 2024. For a full description of this figure please contact: www.csiro.au/contact]](/-/media/Environment/SOTC-2024/Figures/SotC24_GHG-01_v01.png?mw=319) The global annual mean CO2 concentration in 2023 was 419.2 ppm—a 51% increase from the concentration of 277 ppm in 1750 found from air trapped in Antarctic ice.
The global annual mean CO2 concentration in 2023 was 419.2 ppm—a 51% increase from the concentration of 277 ppm in 1750 found from air trapped in Antarctic ice.
Other long-lived greenhouse gases also contribute to global warming. The most significant of the non-CO2 greenhouse gases are methane and nitrous oxide. In 2023, the global annual mean concentration of methane was 1,919 parts per billion (ppb), while for nitrous oxide it was 337 ppb. Respectively, these are rises of 162% and 23% above their 1750 levels of 731 ppb and 273 ppb measured in Antarctic and Greenland ice.
Methane (CH4) is the second most important greenhouse gas in terms of radiative forcing and is emitted from a wide range of sources. Natural microbial decomposition of organic matter in wetlands is the largest single source of methane emissions. However, human activities are responsible for emissions from fossil fuel extraction and use (including natural gas), farming of livestock, rice cultivation and waste from landfills and agriculture. Together, these sources account for about 65% of global methane emissions. Methane has a global warming potential 81 times that of CO2 when measured over a 20-year timeframe. However, it persists in the atmosphere for only around a decade, so efforts to reduce methane emissions will have a large impact on reducing warming on a short timescale. Therefore, reducing atmospheric methane is an important component of pathways to manage climate change. However, since 2020, atmospheric methane concentration has increased rapidly, by more than 10 ppb per year, with rises of 13 and 10 ppb in 2022 and 2023 respectively.
Nitrous oxide (N2O) has a global warming potential 273 times that of CO2 when measured over a 20-year timeframe. It is emitted naturally from the land and oceans. Use of nitrogenous fertilisers is the largest anthropogenic source, and it has been rising steadily in recent decades, leading to accelerating atmospheric growth rates. Throughout 2022 and 2023, nitrous oxide has grown in the atmosphere by more than 1 ppb per year. The growth rate of nitrous oxide, measured directly or through Antarctic ice and compressed snow (firn), has been less than 1 ppb per year for at least the past 2000 years, until the last decade when it has been greater than 1 ppb per year 7 years out of 10.
Global anthropogenic CO2 emissions have levelled off over the last decade after having increased almost continuously for more than a century prior to the early 2010s. Relatively stable emissions from ongoing fossil fuel use and land-use change mean that CO2 has continued to grow in the atmosphere throughout 2022 and 2023 at a rate of more than 2 ppm per year. This growth rate is similar to averages for the past decade and higher than typical rates in the decades prior to the 2010s. Substantial global emissions reductions, sustained over a period of 5–10 years, will be required before there is an attributable decline in the atmospheric growth rate of CO2. To abate climate change requires greenhouse gases to stop accumulating in the atmosphere. This requires the world to reach global net zero emissions; a state in which any residual greenhouse gas emissions are balanced by removal of an equivalent amount of greenhouse gases from the atmosphere.
The combined impact of all greenhouse gases can be converted to a CO2-e atmospheric concentration by considering the global warming potential (ability to trap heat in the atmosphere) of each gas and its concentration. The annual average CO2-e measured at Kennaook/Cape Grim reached 518 ppm in 2023, and 524 ppm globally.
The cumulative climate effect of all the long-lived greenhouse gases (CO2, CH4, N2O and the synthetic greenhouse gases) in the atmosphere can be expressed as radiative forcing. Radiative forcing is the enhancement of the net radiation, through the additional trapping of energy within the atmosphere. It quantifies the increase in energy in the climate system due to the accumulation of long-lived greenhouse gases into the atmosphere relative to 1750. Because it is the most abundant greenhouse gas, CO2 is the largest contributor to radiative forcing, but other gases make substantial and growing contributions. Other changes to the earth system since 1750, including short-lived gases, aerosols (airborne particles), albedo (surface reflectivity) and solar variability have made much smaller contributions to radiative forcing.
Measurements of air extracted from Antarctic ice cores and firn extend the atmospheric composition record back before direct observations commenced. These measurements show that all 3 major greenhouse gases (CO2, CH4 and N2O) were relatively stable for most of the past 2000 years, before beginning to rise in the late 18th century, coincident with industrialisation and the expansion of agriculture. All 3 major greenhouse gases have been increasing at an accelerating pace since around 1850 and are now rising at historically unprecedented rates.
The increase in CO2 concentration since 1800 originates principally from fossil fuel and land clearing emissions. This is determined by using the isotopes of carbon in atmospheric CO2 to identify its different sources, with measurements of carbon-13 and carbon-14 relative to carbon-12.
Kennaook/Cape Grim Baseline Air Pollution Station
The Kennaook/Cape Grim Baseline Air Pollution Station, located at the north-west tip of Tasmania, is the Southern Hemisphere’s key greenhouse gas monitoring station in the World Meteorological Organization’s Global Atmosphere Watch program. It has been running continuously for 48 years.
Atmospheric concentrations of CO2 measured at Kennaook/Cape Grim continue to show an upward trend with the decadal growth rates accelerating since measurements began. This is consistent with other stations globally. The annual average CO2 at Kennaook/Cape Grim reached 416.4 ppm in 2023, slightly lower than the global average of 419.2 ppm.
Kennaook/Cape Grim greenhouse gas concentrations are typically lower than the global averages because most emissions originate in the Northern Hemisphere. It takes many months for Northern Hemisphere air, with higher greenhouse gas concentrations, to mix into the Southern Hemisphere and appear in the Kennaook/Cape Grim observations.
Global Carbon Budget
Global emissions of CO2 from fossil fuel use and land-use change continued to increase in recent decades, reaching 40.6 ± 2.9 gigatonnes per year of CO2 in 2019 (1 Gt is equal to 1 billion tonnes).
In the decade from 2011–20, average global anthropogenic CO2 emissions were 38.9 ± 1.8 Gt CO2 per year. Around 90 per cent of global CO2 emissions were from fossil fuels and 10 per cent from land-use change.
The uptake of carbon into ocean and land sinks has grown in response to the higher accumulation of CO2 in the atmosphere.
In the decade from 2011–20, the land and ocean sinks removed on average 29 per cent and 26 per cent of all anthropogenic emissions, respectively. Combined, these sinks are removing more than half of all CO2 emissions from human activities and thus are slowing the rate of increase in atmospheric CO2 and the pace of climate change.
Despite this important uptake by the natural CO2 sinks, CO2 has continued to accumulate in the atmosphere, growing by 18.6 Gt CO2 per year over the decade from 2011–20.
Global carbon budget
- Total anthropogenic CO2 emissions – the sum of fossil and land-use change emissions – levelled off over the past decade after a century-long increase, with a small growth in fossil emissions closely matching a small but uncertain decline in land-use change emissions.
- At current (2023) total annual anthropogenic CO2 emissions of 40.9 GtCO2, the remaining carbon budget for a 50% chance of limiting warming to 1.5 °C will be exceeded in 7 years. The carbon budget is the amount of allowable emissions for limiting warming to a given global mean temperature.
Global emissions from fossil fuel use increased by 1.1 ±1.1% in 2023 from 2022, reaching 36.8±2 billion tonnes of carbon dioxide (GtCO2), compared to 35±2 GtCO2 as the decadal mean of 2013−2022. Emissions from all fuel types (coal, oil, natural gas) increased. Emissions are declining in 26 countries, representing 28% of global emissions, and emissions growth is slowing in other countries. Importantly, these efforts remain insufficient to reverse the growth in global fossil fuel emissions.
Global CO2 emissions from land-use change, the second largest source of CO2 emissions, were 4.1±2.6 GtCO2 in 2023, continuing an estimated small decline (with high uncertainty) over the past 2 decades. Global land-use change emissions from permanent forest loss through deforestation are larger than CO2 removals from reforestation and afforestation.
Total CO2 emissions – the sum of fossil and land-use change emissions have levelled off over the past decade, with a small growth in fossil emissions closely matching a small but uncertain decline in land-use change emissions. Total emissions were 40.9±3.2 GtCO2 in 2023 leading to a further increase in atmospheric CO2. The levelling off over the last decade follows emissions increasing almost continuously for more than a century prior to the 2010s.
If current CO2 emissions levels persist, the remaining carbon budget for a 50% chance to limit warming to 1.5 °C above pre-industrial levels will be exceeded in 7 years. Within 15 years, the remaining budget for 1.7 °C would be exceeded. Returning global temperatures below these thresholds after they have been crossed would require a huge increase in carbon dioxide removal after global net zero emission has been reached.
The land and ocean CO2 sinks continue to take up around half of global CO2 emissions, despite the negative impact of climate change on the land and ocean sinks.
![Fossil fuel burning is the main source of CO2. CO2 is absorbed by the ocean and land, or remains in the atmosphere. Stylised figure showing major sources and sinks of global CO2 in marine and terrestrial systems between 2013 and 2022. Fossil fuels make the largest contribution to atmospheric CO2 with the biosphere and oceans being the largest CO2 sinks. For a full description of this figure please contact: www.csiro.au/contact]](/-/media/Environment/SOTC-2024/Figures/SotC24_GCB-01_v01.png?mw=800)
The Australian carbon budget
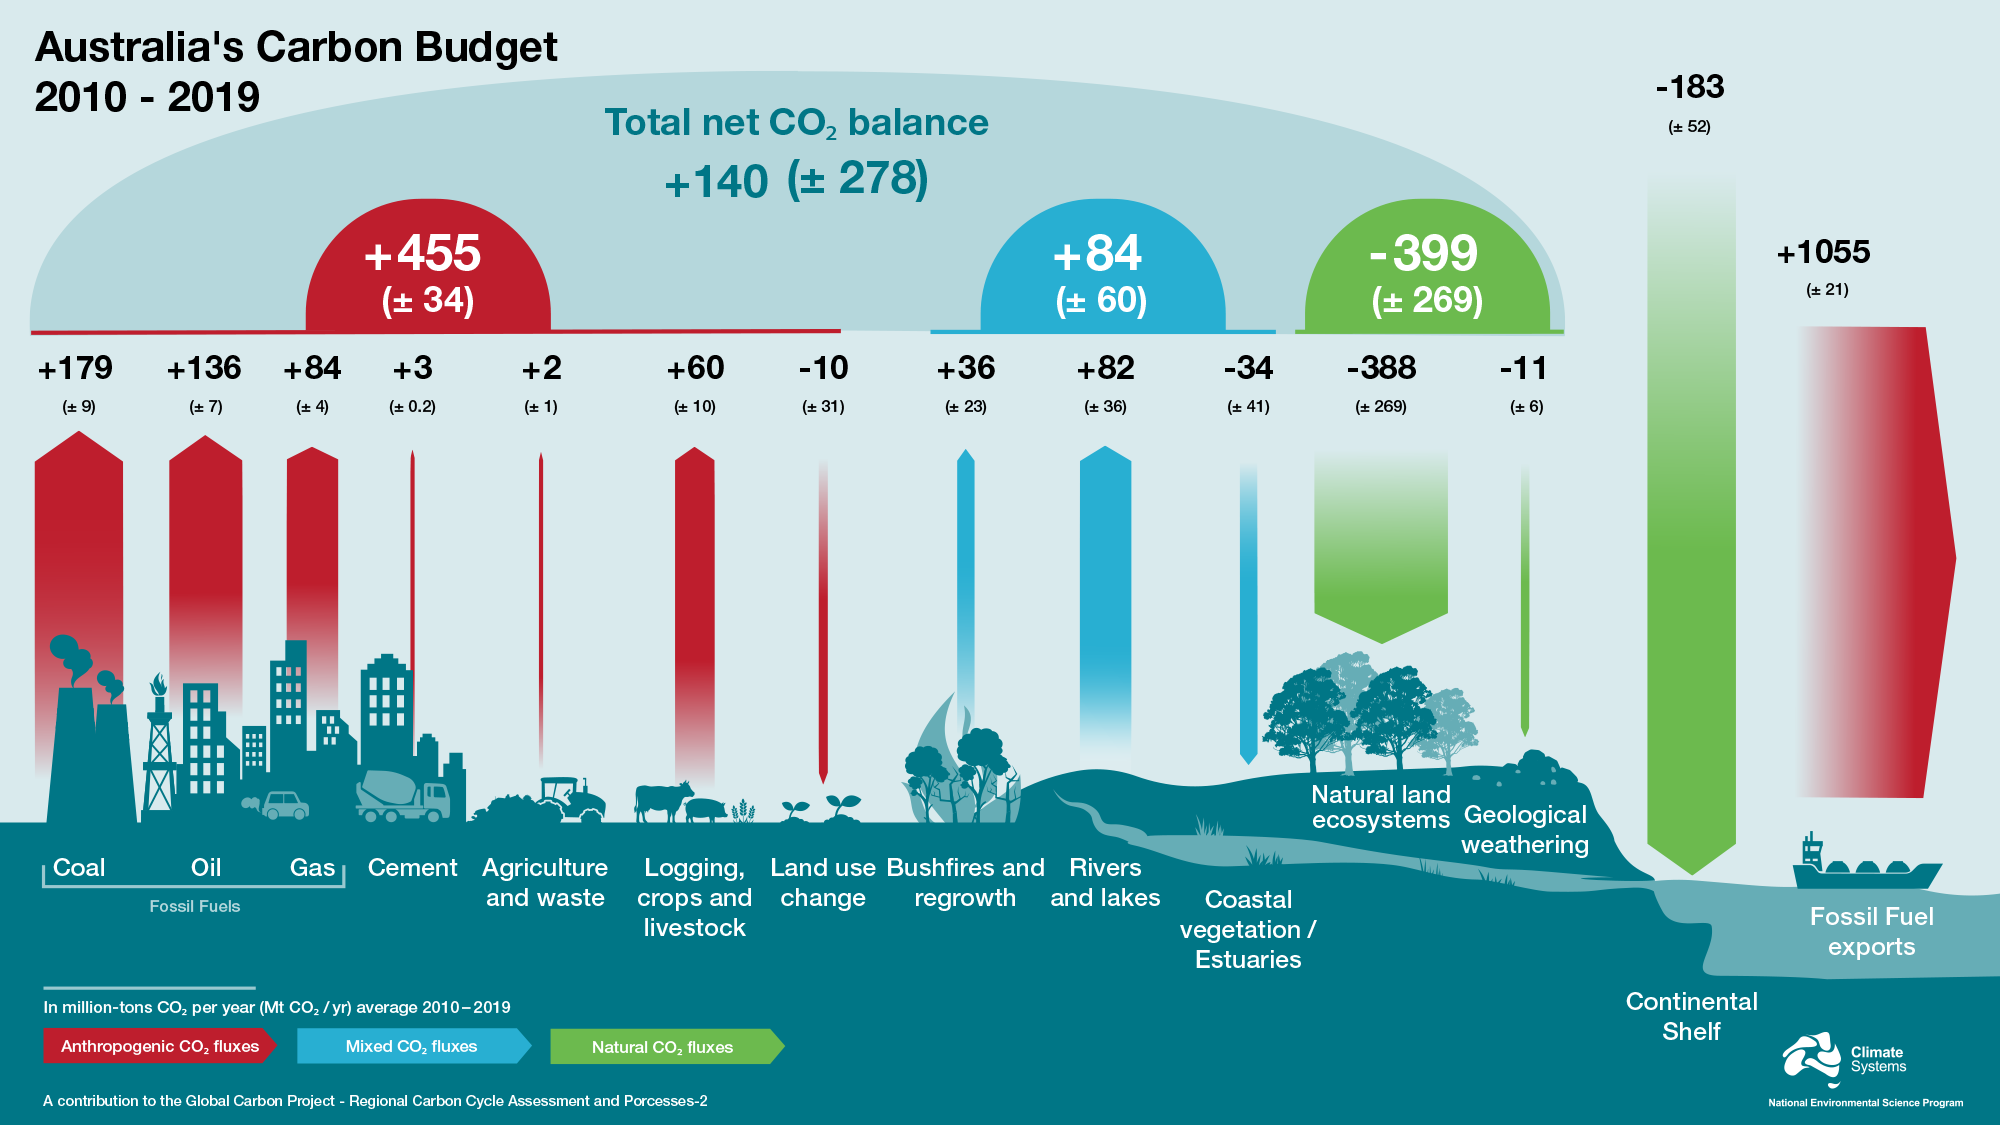
Australia’s carbon sources are dominated by human emissions from the extraction and use of fossil fuels − coal, oil, and gas. Logging, crops, and other agriculture add additional CO2 to the atmosphere. Together these anthropogenic sources averaged a total of 455 MtCO2 emissions per year between 2010 and 2019.
Forests, rangelands, and coastal ecosystems remove a significant portion of anthropogenic emissions, with coastal shelves and open oceans also being a sink for CO2.
CO2 emissions from wildfires and prescribed burns are large sources of CO2 and can be as high as or higher than all fossil fuel emissions in extreme fire years such as during the Black Summer fires. However, post-fire regeneration over the following years to decades offsets a large portion of the emissions, with an average net emissions of 36 MtCO2 per year during the last decade.
When we combine all the land-based CO2 sources and sinks with the fossil fuel emissions, Australia was a net source to the atmosphere of 200 million tonnes of CO2 per year between 2010 and 2019. If we count the CO2 sinks from coastal ecosystems, the contribution to the atmosphere is smaller. This means CO2 sinks partially offset fossil fuel emissions, albeit with large uncertainties. Australia also transfers large amounts of carbon embedded in its fossil fuel exports, the emissions of which are accounted for in the country where the combustion occurs.
This new assessment of the Australian carbon budget shows that the net annual carbon balance of the entire continent is highly variable from year to year, owing to changes in the behaviour of natural CO2 sinks. Australia can be a large net source of CO2 in one year, to carbon neutral the next, to a large net CO2 sink in the next year. This ‘boom and bust’ dynamics of Australia’s carbon budget, largely driven by the responses of the land CO2 sinks to rainfall and fire, underscores the potential large impacts of future climate change on Australia’s net carbon balance.
Greenhouse gases
- Global average concentrations of all major long-lived greenhouse gases continue to rise in the atmosphere, driving further climate change.
- The rate of CO2 accumulation in the atmosphere has increased every decade since atmospheric measurements began. Global average annual mean CO2 concentration reached 419.2 parts per million (ppm) in 2023. Adding all greenhouse gases together, concentrations reached 524 ppm of CO2-equivalent.
- Over the past 2 years, the amounts of atmospheric methane and nitrous oxide have increased rapidly.
The primary and unequivocal driver of climate change since the 1850−1900 period is the accumulation of greenhouse gases in the atmosphere. Global mean surface warming throughout the 21st century will be largely determined by cumulative emissions of carbon dioxide (CO2) and the other long-lived greenhouse gases, and what proportion of those emissions persist in the atmosphere.
Globally averaged atmospheric concentrations of all major long-lived greenhouse gases, and a group of synthetic greenhouse gases industrially produced for uses such as refrigeration, continue to rise.
The global annual mean CO2 concentration in 2023 was 419.2 ppm—a 51% increase from the concentration of 277 ppm in 1750 found from air trapped in Antarctic ice.
CO2 measured at Kennaook/Cape Grim has increased at an accelerating rate over the past four decades. Line chart which shows background monthly mean CO2 calculated from hourly clean-air CO2 measurements at the Kennaook/Cape Grim Baseline Air Pollution Station from 1976 through to June 2024. CO2 rise (ppm): For a full description of this figure please contact: www.csiro.au/contact
Other long-lived greenhouse gases also contribute to global warming. The most significant of the non-CO2 greenhouse gases are methane and nitrous oxide. In 2023, the global annual mean concentration of methane was 1,919 parts per billion (ppb), while for nitrous oxide it was 337 ppb. Respectively, these are rises of 162% and 23% above their 1750 levels of 731 ppb and 273 ppb measured in Antarctic and Greenland ice.
Methane (CH4) is the second most important greenhouse gas in terms of radiative forcing and is emitted from a wide range of sources. Natural microbial decomposition of organic matter in wetlands is the largest single source of methane emissions. However, human activities are responsible for emissions from fossil fuel extraction and use (including natural gas), farming of livestock, rice cultivation and waste from landfills and agriculture. Together, these sources account for about 65% of global methane emissions. Methane has a global warming potential 81 times that of CO2 when measured over a 20-year timeframe. However, it persists in the atmosphere for only around a decade, so efforts to reduce methane emissions will have a large impact on reducing warming on a short timescale. Therefore, reducing atmospheric methane is an important component of pathways to manage climate change. However, since 2020, atmospheric methane concentration has increased rapidly, by more than 10 ppb per year, with rises of 13 and 10 ppb in 2022 and 2023 respectively.
Nitrous oxide (N2O) has a global warming potential 273 times that of CO2 when measured over a 20-year timeframe. It is emitted naturally from the land and oceans. Use of nitrogenous fertilisers is the largest anthropogenic source, and it has been rising steadily in recent decades, leading to accelerating atmospheric growth rates. Throughout 2022 and 2023, nitrous oxide has grown in the atmosphere by more than 1 ppb per year. The growth rate of nitrous oxide, measured directly or through Antarctic ice and compressed snow (firn), has been less than 1 ppb per year for at least the past 2000 years, until the last decade when it has been greater than 1 ppb per year 7 years out of 10.
Global anthropogenic CO2 emissions have levelled off over the last decade after having increased almost continuously for more than a century prior to the early 2010s. Relatively stable emissions from ongoing fossil fuel use and land-use change mean that CO2 has continued to grow in the atmosphere throughout 2022 and 2023 at a rate of more than 2 ppm per year. This growth rate is similar to averages for the past decade and higher than typical rates in the decades prior to the 2010s. Substantial global emissions reductions, sustained over a period of 5–10 years, will be required before there is an attributable decline in the atmospheric growth rate of CO2. To abate climate change requires greenhouse gases to stop accumulating in the atmosphere. This requires the world to reach global net zero emissions; a state in which any residual greenhouse gas emissions are balanced by removal of an equivalent amount of greenhouse gases from the atmosphere.
The combined impact of all greenhouse gases can be converted to a CO2-e atmospheric concentration by considering the global warming potential (ability to trap heat in the atmosphere) of each gas and its concentration. The annual average CO2-e measured at Kennaook/Cape Grim reached 518 ppm in 2023, and 524 ppm globally.
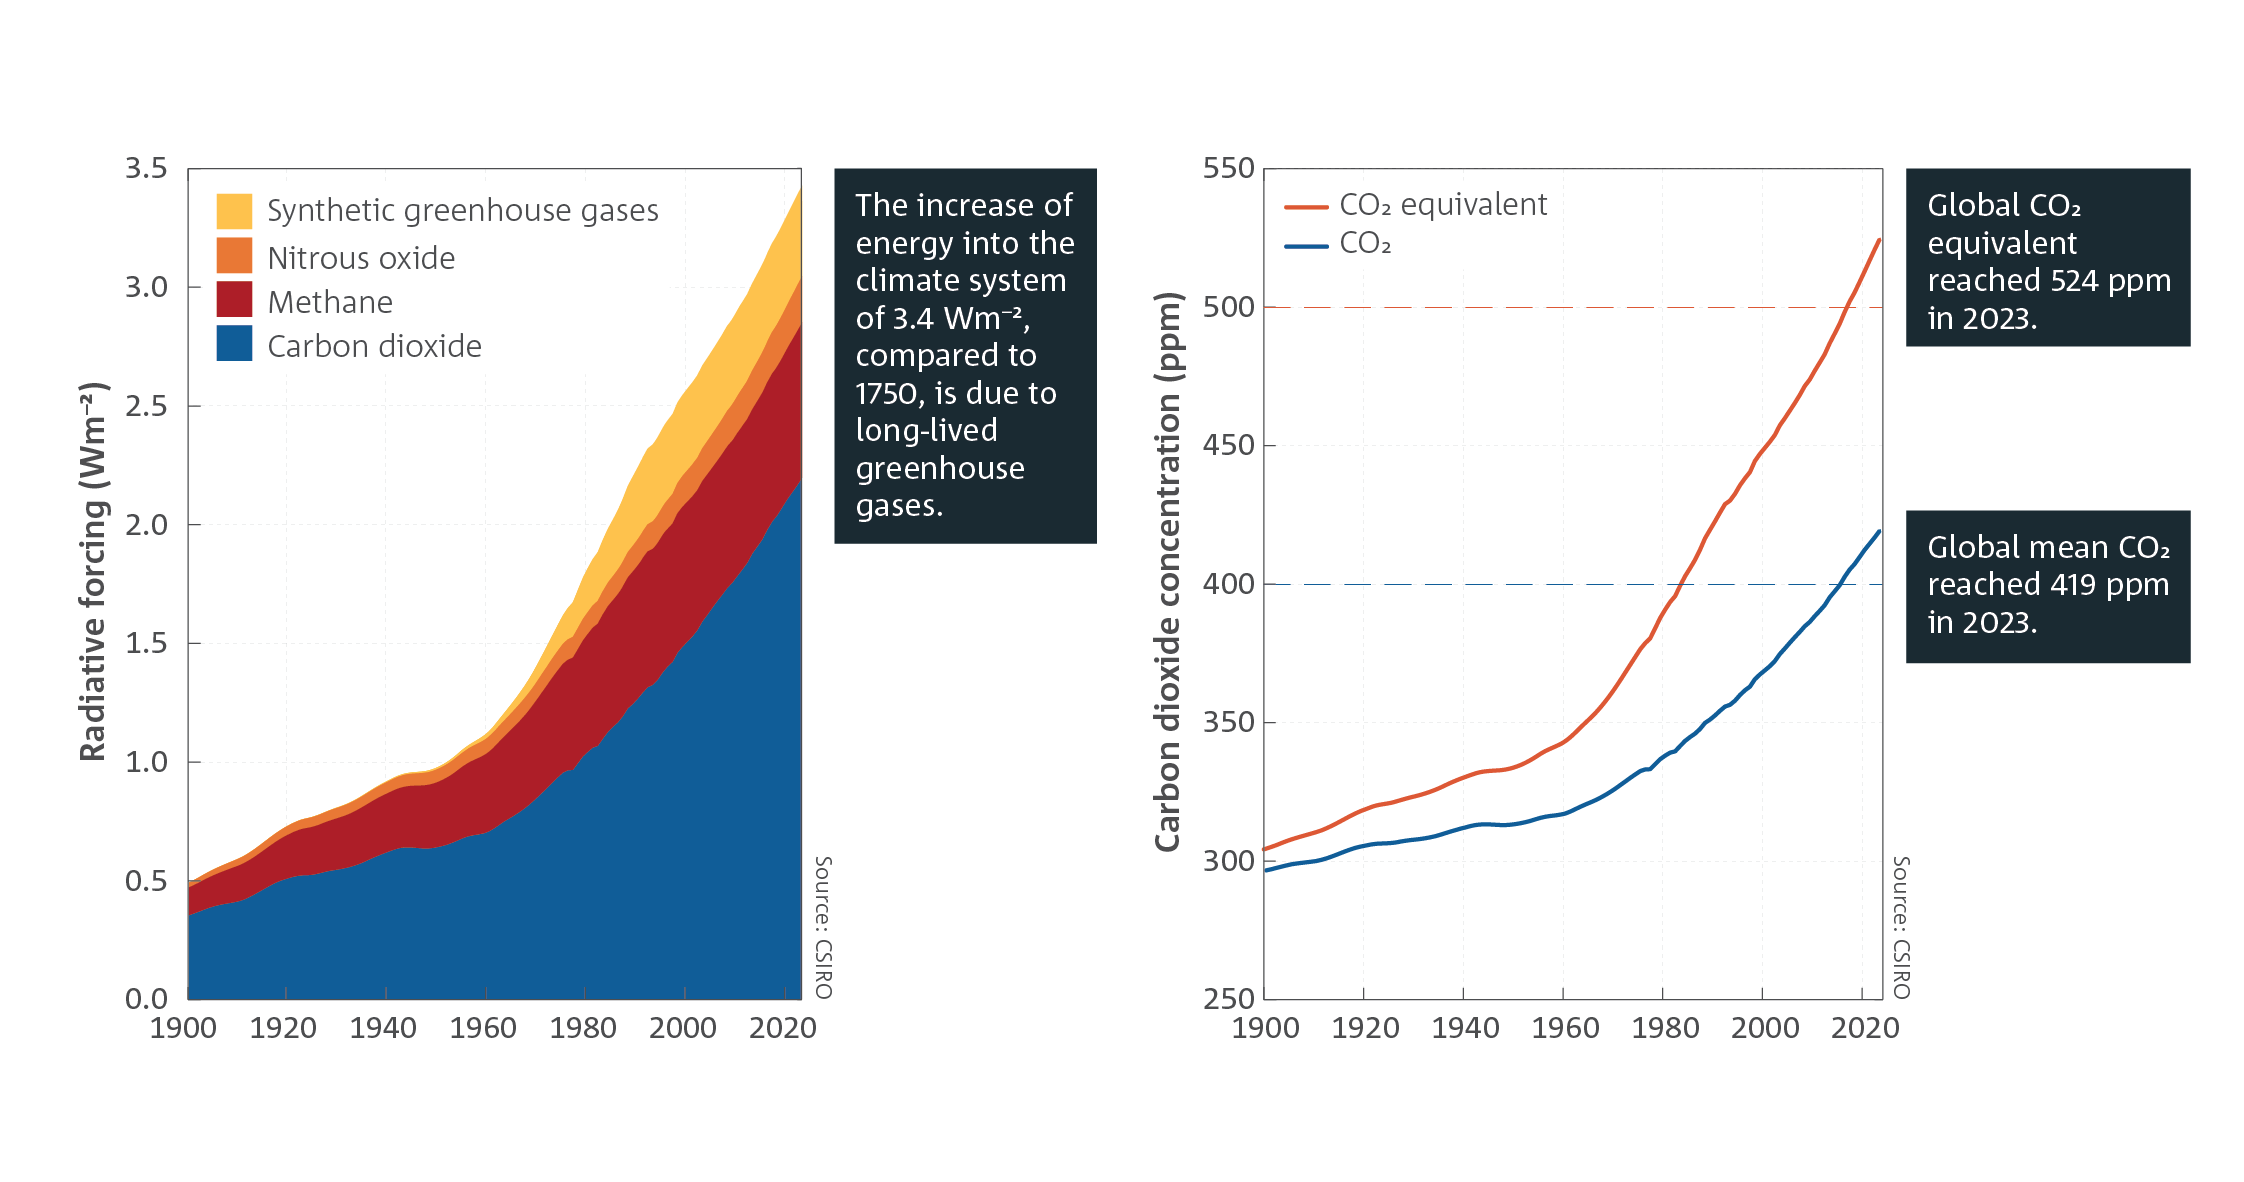
Left: The increase of energy into the climate system of 3.4 Wm–2, compared to 1750, is due to long-lived greenhouse gases. Stacked area chart which shows the radiative forcing of carbon dioxide, nitrous oxide, methane and synthetic greenhouse gases from 1900 to 2023. For a full description of this figure please contact: www.csiro.au/contact Line chart of both CO2 and CO2 equivalent which shows two upwards curves. For a full description of this figure please contact: www.csiro.au/contact
Right: Global CO2 equivalent reached 524 ppm in 2023. Global mean CO2 reached 419 ppm in 2023.
The cumulative climate effect of all the long-lived greenhouse gases (CO2, CH4, N2O and the synthetic greenhouse gases) in the atmosphere can be expressed as radiative forcing. Radiative forcing is the enhancement of the net radiation, through the additional trapping of energy within the atmosphere. It quantifies the increase in energy in the climate system due to the accumulation of long-lived greenhouse gases into the atmosphere relative to 1750. Because it is the most abundant greenhouse gas, CO2 is the largest contributor to radiative forcing, but other gases make substantial and growing contributions. Other changes to the earth system since 1750, including short-lived gases, aerosols (airborne particles), albedo (surface reflectivity) and solar variability have made much smaller contributions to radiative forcing.
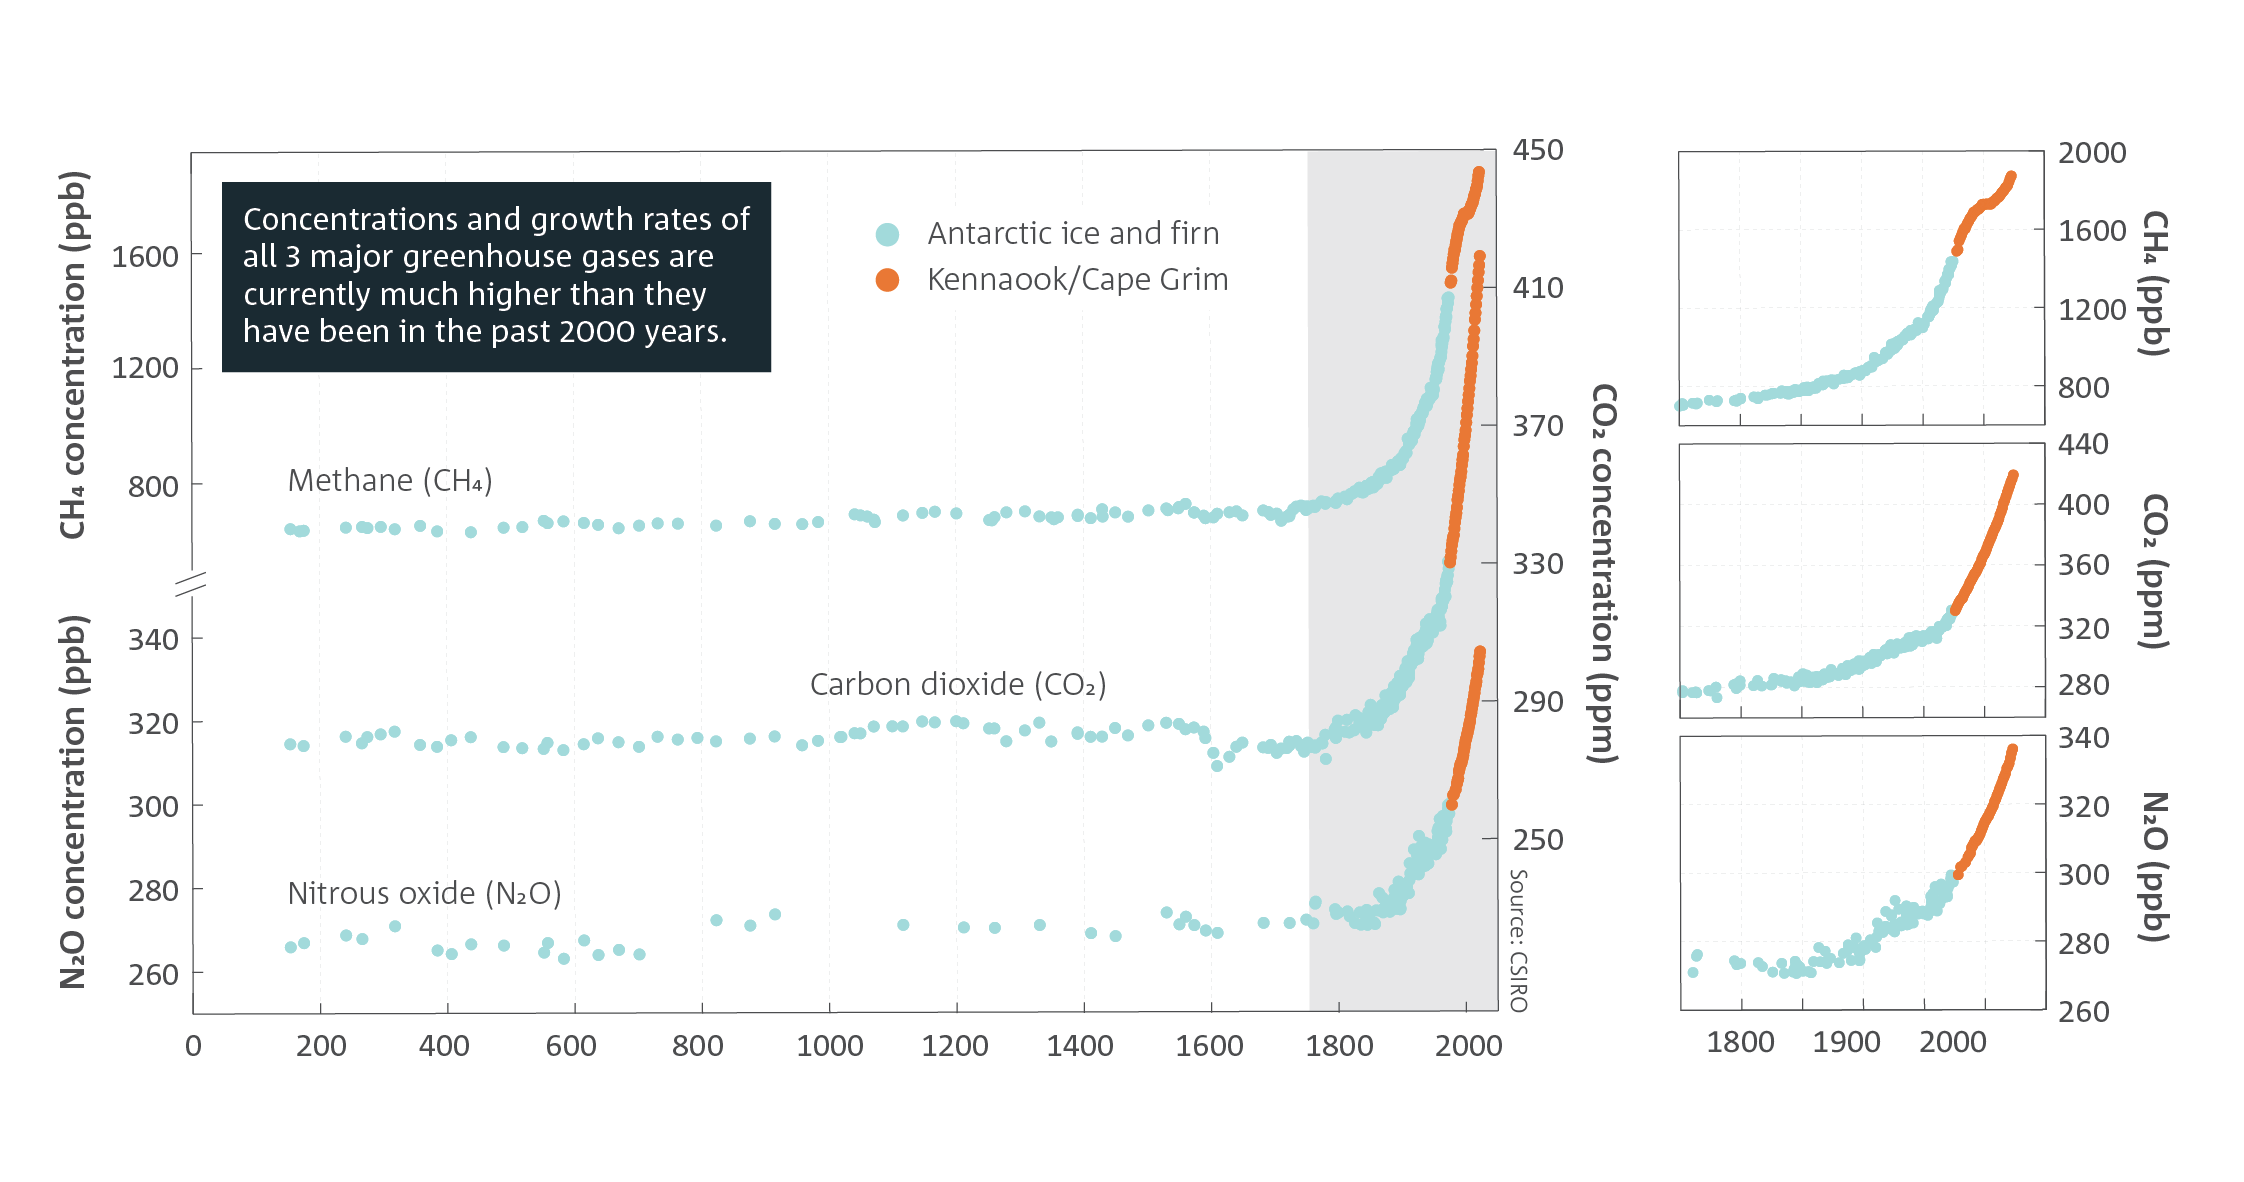
Measurements of air extracted from Antarctic ice cores and firn extend the atmospheric composition record back before direct observations commenced. These measurements show that all 3 major greenhouse gases (CO2, CH4 and N2O) were relatively stable for most of the past 2000 years, before beginning to rise in the late 18th century, coincident with industrialisation and the expansion of agriculture. All 3 major greenhouse gases have been increasing at an accelerating pace since around 1850 and are now rising at historically unprecedented rates.
The increase in CO2 concentration since 1800 originates principally from fossil fuel and land clearing emissions. This is determined by using the isotopes of carbon in atmospheric CO2 to identify its different sources, with measurements of carbon-13 and carbon-14 relative to carbon-12.
Kennaook/Cape Grim Baseline Air Pollution Station
The Kennaook/Cape Grim Baseline Air Pollution Station, located at the north-west tip of Tasmania, is the Southern Hemisphere’s key greenhouse gas monitoring station in the World Meteorological Organization’s Global Atmosphere Watch program. It has been running continuously for 48 years.
Atmospheric concentrations of CO2 measured at Kennaook/Cape Grim continue to show an upward trend with the decadal growth rates accelerating since measurements began. This is consistent with other stations globally. The annual average CO2 at Kennaook/Cape Grim reached 416.4 ppm in 2023, slightly lower than the global average of 419.2 ppm.
Kennaook/Cape Grim greenhouse gas concentrations are typically lower than the global averages because most emissions originate in the Northern Hemisphere. It takes many months for Northern Hemisphere air, with higher greenhouse gas concentrations, to mix into the Southern Hemisphere and appear in the Kennaook/Cape Grim observations.
Global Carbon Budget
Global emissions of CO2 from fossil fuel use and land-use change continued to increase in recent decades, reaching 40.6 ± 2.9 gigatonnes per year of CO2 in 2019 (1 Gt is equal to 1 billion tonnes).
In the decade from 2011–20, average global anthropogenic CO2 emissions were 38.9 ± 1.8 Gt CO2 per year. Around 90 per cent of global CO2 emissions were from fossil fuels and 10 per cent from land-use change.
The uptake of carbon into ocean and land sinks has grown in response to the higher accumulation of CO2 in the atmosphere.
In the decade from 2011–20, the land and ocean sinks removed on average 29 per cent and 26 per cent of all anthropogenic emissions, respectively. Combined, these sinks are removing more than half of all CO2 emissions from human activities and thus are slowing the rate of increase in atmospheric CO2 and the pace of climate change.
Despite this important uptake by the natural CO2 sinks, CO2 has continued to accumulate in the atmosphere, growing by 18.6 Gt CO2 per year over the decade from 2011–20.
Global carbon budget
- Total anthropogenic CO2 emissions – the sum of fossil and land-use change emissions – levelled off over the past decade after a century-long increase, with a small growth in fossil emissions closely matching a small but uncertain decline in land-use change emissions.
- At current (2023) total annual anthropogenic CO2 emissions of 40.9 GtCO2, the remaining carbon budget for a 50% chance of limiting warming to 1.5 °C will be exceeded in 7 years. The carbon budget is the amount of allowable emissions for limiting warming to a given global mean temperature.
Global emissions from fossil fuel use increased by 1.1 ±1.1% in 2023 from 2022, reaching 36.8±2 billion tonnes of carbon dioxide (GtCO2), compared to 35±2 GtCO2 as the decadal mean of 2013−2022. Emissions from all fuel types (coal, oil, natural gas) increased. Emissions are declining in 26 countries, representing 28% of global emissions, and emissions growth is slowing in other countries. Importantly, these efforts remain insufficient to reverse the growth in global fossil fuel emissions.
Global CO2 emissions from land-use change, the second largest source of CO2 emissions, were 4.1±2.6 GtCO2 in 2023, continuing an estimated small decline (with high uncertainty) over the past 2 decades. Global land-use change emissions from permanent forest loss through deforestation are larger than CO2 removals from reforestation and afforestation.
Total CO2 emissions – the sum of fossil and land-use change emissions have levelled off over the past decade, with a small growth in fossil emissions closely matching a small but uncertain decline in land-use change emissions. Total emissions were 40.9±3.2 GtCO2 in 2023 leading to a further increase in atmospheric CO2. The levelling off over the last decade follows emissions increasing almost continuously for more than a century prior to the 2010s.
If current CO2 emissions levels persist, the remaining carbon budget for a 50% chance to limit warming to 1.5 °C above pre-industrial levels will be exceeded in 7 years. Within 15 years, the remaining budget for 1.7 °C would be exceeded. Returning global temperatures below these thresholds after they have been crossed would require a huge increase in carbon dioxide removal after global net zero emission has been reached.
The land and ocean CO2 sinks continue to take up around half of global CO2 emissions, despite the negative impact of climate change on the land and ocean sinks.
The Australian carbon budget
Australia’s carbon sources are dominated by human emissions from the extraction and use of fossil fuels − coal, oil, and gas. Logging, crops, and other agriculture add additional CO2 to the atmosphere. Together these anthropogenic sources averaged a total of 455 MtCO2 emissions per year between 2010 and 2019.
Forests, rangelands, and coastal ecosystems remove a significant portion of anthropogenic emissions, with coastal shelves and open oceans also being a sink for CO2.
CO2 emissions from wildfires and prescribed burns are large sources of CO2 and can be as high as or higher than all fossil fuel emissions in extreme fire years such as during the Black Summer fires. However, post-fire regeneration over the following years to decades offsets a large portion of the emissions, with an average net emissions of 36 MtCO2 per year during the last decade.
When we combine all the land-based CO2 sources and sinks with the fossil fuel emissions, Australia was a net source to the atmosphere of 200 million tonnes of CO2 per year between 2010 and 2019. If we count the CO2 sinks from coastal ecosystems, the contribution to the atmosphere is smaller. This means CO2 sinks partially offset fossil fuel emissions, albeit with large uncertainties. Australia also transfers large amounts of carbon embedded in its fossil fuel exports, the emissions of which are accounted for in the country where the combustion occurs.
This new assessment of the Australian carbon budget shows that the net annual carbon balance of the entire continent is highly variable from year to year, owing to changes in the behaviour of natural CO2 sinks. Australia can be a large net source of CO2 in one year, to carbon neutral the next, to a large net CO2 sink in the next year. This ‘boom and bust’ dynamics of Australia’s carbon budget, largely driven by the responses of the land CO2 sinks to rainfall and fire, underscores the potential large impacts of future climate change on Australia’s net carbon balance.