This eighth biennial State of the Climate report is a synthesis of the science that underpins our understanding of Australia’s climate. It is intended to inform economic, environmental and social decision-making by governments, industries and communities.
Observations, reconstructions of past climate and climate modelling continue to provide a consistent picture of ongoing, long‑term climate change interacting with underlying natural variability. Associated changes in weather and climate extremes— such as extreme heat, heavy rainfall, coastal inundation, fire weather and drought—exacerbate existing pressures on the health and wellbeing of our communities and ecosystems. These changes in the weather and climate are happening at an increasing pace; the past decade has seen record-breaking extremes contributing to natural disasters that are exacerbated by anthropogenic (human-caused) climate change, including ‘compound events’, where multiple hazards and/or drivers occur together or in a close sequence, which intensifies their impacts. These changes have a growing effect on the lives and livelihoods of all Australians. Australia must plan for, and adapt to, the changing nature of climate risk now and in the decades ahead. The severity of impacts on Australians and our environment will depend on the speed at which global greenhouse gas emissions can be reduced.
Key points
Australia
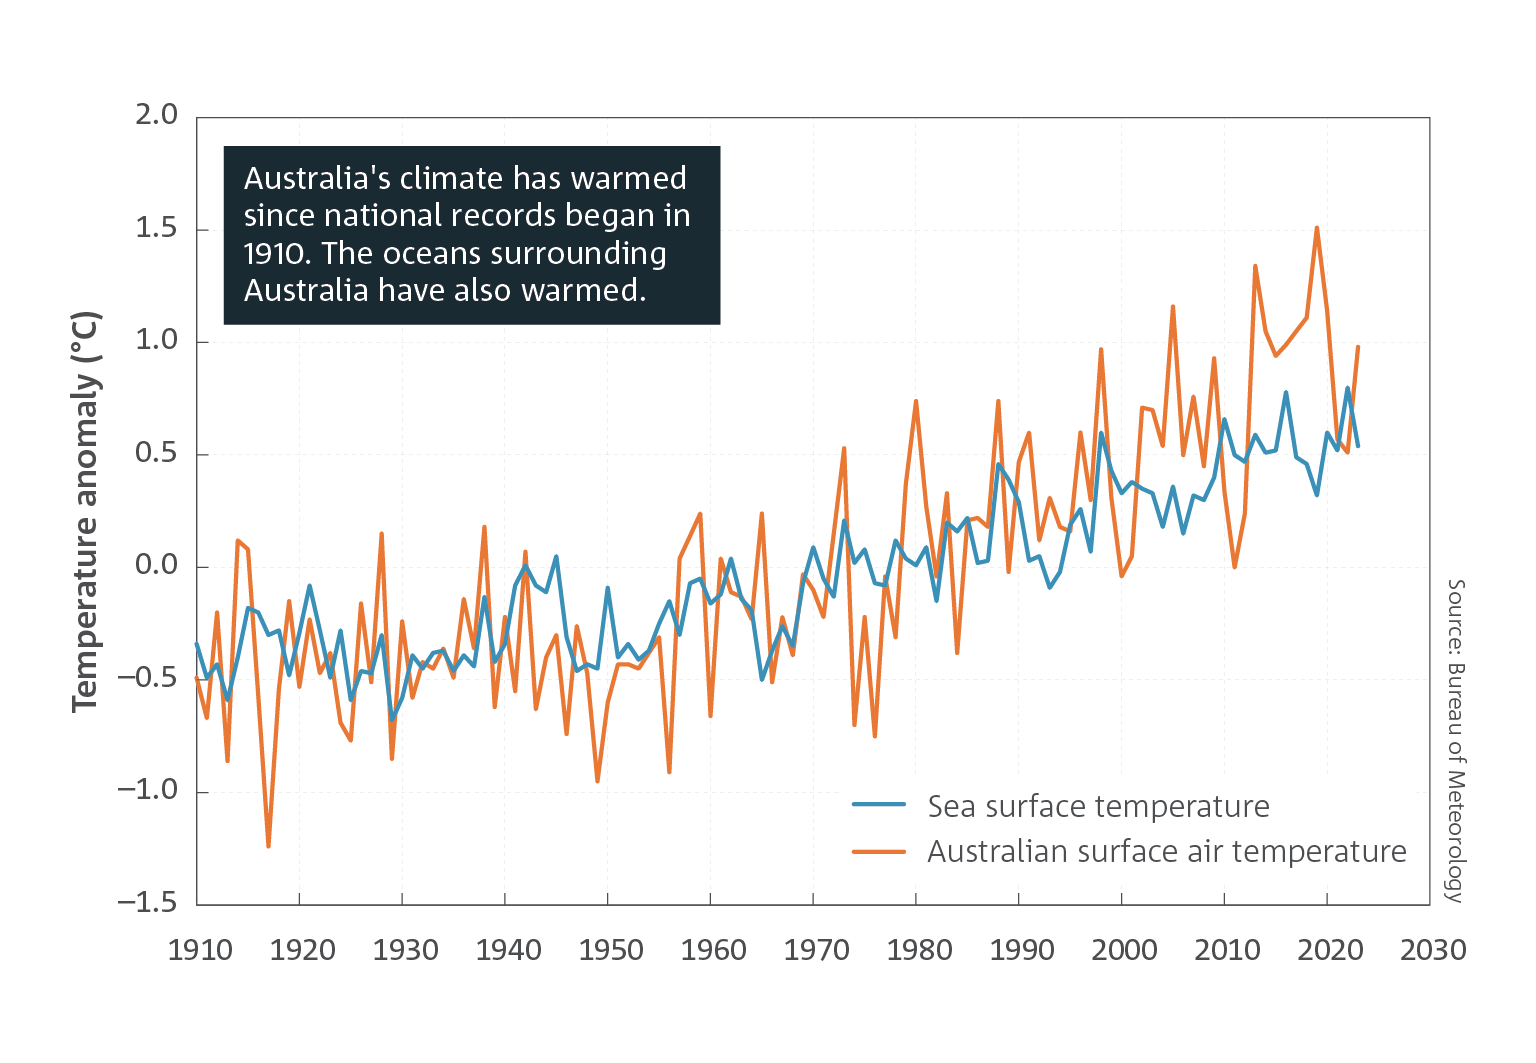
- Australia’s climate has warmed by an average of 1.51 ± 0.23 °C since national records began in 1910.
- Sea surface temperatures have increased by an average of 1.08 °C since 1900.
- The warming has led to an increase in the frequency of extreme heat events over land and in the oceans.
- In the south-west of Australia there has been a decrease of around 16% in April to October rainfall since 1970. Across the same region, May to July rainfall has seen the largest reduction, by around 20% since 1970.
- In the south-east of Australia, there has been a decrease of around 9% in April to October rainfall since 1994.
- Heavy short-term rainfall events are becoming more intense.
- There has been a decrease in streamflow at most gauges across Australia since 1970.
- There has been an increase in rainfall and streamflow across parts of northern Australia since the 1970s.
- There has been an increase in extreme fire weather, and a longer fire season, across large parts of the country since the 1950s.
- There has been a decrease in the number of tropical cyclones observed in the Australian region since at least 1982.
- Snow depth, snow cover and number of snow days have decreased in alpine regions since the late 1950s.
- Oceans around Australia are becoming more acidic, with changes happening faster in recent decades.
- Sea levels are rising around Australia, including more frequent extreme high levels that increase the risk of inundation and damage to coastal infrastructure and communities.
Global
![Globally averaged air temperature at the Earth’s surface has warmed by about 1.2 degrees Celsius since reliable records began in 1850. Bar chart of global surface temperature anomalies of the Earth (land and ocean), relative to the 1961 to 1990 average, in degrees Celsius, from 1950 to 2023. For a full description of this figure please contact: helpdesk.climate@bom.gov.au]](/-/media/Environment/SOTC-2024/Figures/SotC24_RG-02_v01.png?mw=319) Concentrations of all major long‑lived greenhouse gases in the atmosphere continue to increase. Global annual mean carbon dioxide (CO2) concentrations reached 419.2 parts per million (ppm) in 2023 and the CO2 equivalent (CO2-e) of all greenhouse gases reached 524 ppm. These are the highest levels on Earth in at least 2 million years.
Concentrations of all major long‑lived greenhouse gases in the atmosphere continue to increase. Global annual mean carbon dioxide (CO2) concentrations reached 419.2 parts per million (ppm) in 2023 and the CO2 equivalent (CO2-e) of all greenhouse gases reached 524 ppm. These are the highest levels on Earth in at least 2 million years.- Global fossil fuel CO2 emissions, the principal driver of the growth in CO2 concentrations, are continuing to increase. Overall anthropogenic CO2 emissions, including fossil fuel and land‑use change emissions, have levelled off over the last decade after increasing for more than a century prior to the 2010s.
- In 2022 and 2023, the amounts of methane (CH4) and nitrous oxide (N2O), both greenhouse gases, in the atmosphere increased rapidly.
- Globally averaged air temperature at the Earth’s surface has warmed by about 1.2 °C since reliable records began in 1850. Each decade since 1980 has been warmer than the last, with 2011–2020 being around 0.2 °C warmer than 2001–2010. 2023 was the warmest year on record globally.
![Global annual mean CO2 reached 419 ppm in 2023. Global CO2 equivalent reached 524 ppm in 2023. Line chart of both CO2 and CO2 equivalent which shows two upwards curves. For a full description of this figure please contact: www.csiro.au/contact]](/-/media/Environment/SOTC-2024/Figures/SotC24_RG-03_v02.png?mw=319) The world’s oceans, especially in the Southern Hemisphere, have taken up more than 90% of the extra energy stored by the planet (as heat) arising from enhanced greenhouse gas concentrations.
The world’s oceans, especially in the Southern Hemisphere, have taken up more than 90% of the extra energy stored by the planet (as heat) arising from enhanced greenhouse gas concentrations.- The ice sheets and ice shelves of Antarctica and Greenland are losing ice due to a warmer climate, and contributing to global sea level rise.
- There has been an abrupt decrease in Antarctic sea-ice extent since 2015, after a small increase over the period from 1979 to 2014.
- Around half of all CO2 emissions from human activities are absorbed by land and ocean sinks, which act to slow the rate of increase in atmospheric CO2.
- Global mean sea levels have risen by over 22 cm since 1900; half of this has occurred since 1970.
Future
In the coming decades, Australia will experience ongoing changes to its weather and climate. The changes are projected to include:
- Continued increase in air temperatures, with more heat extremes and fewer cold extremes.
- Continued decrease, on average, in cool season rainfall across many regions of southern and eastern Australia, which will likely lead to more time in drought.
- More intense short-duration heavy rainfall events even in regions where the average rainfall decreases or stays the same.
- Continued increase in the number of dangerous fire weather days and a longer fire season for much of southern and eastern Australia.
- Further sea level rise and continued warming and acidification of the oceans around Australia.
- Increased and longer-lasting marine heatwaves that will affect marine environments such as kelp forests and increase the likelihood of more frequent and severe bleaching events in coral reefs around Australia, including the Great Barrier Reef and Ningaloo Reef.
- Fewer tropical cyclones, but with higher intensity on average, and greater impacts when they occur through higher rain rates and higher sea level.
- Reduced average snow depth in alpine regions, but with variations from year to year.
This eighth biennial State of the Climate report is a synthesis of the science that underpins our understanding of Australia’s climate. It is intended to inform economic, environmental and social decision-making by governments, industries and communities.
Observations, reconstructions of past climate and climate modelling continue to provide a consistent picture of ongoing, long‑term climate change interacting with underlying natural variability. Associated changes in weather and climate extremes— such as extreme heat, heavy rainfall, coastal inundation, fire weather and drought—exacerbate existing pressures on the health and wellbeing of our communities and ecosystems. These changes in the weather and climate are happening at an increasing pace; the past decade has seen record-breaking extremes contributing to natural disasters that are exacerbated by anthropogenic (human-caused) climate change, including ‘compound events’, where multiple hazards and/or drivers occur together or in a close sequence, which intensifies their impacts. These changes have a growing effect on the lives and livelihoods of all Australians. Australia must plan for, and adapt to, the changing nature of climate risk now and in the decades ahead. The severity of impacts on Australians and our environment will depend on the speed at which global greenhouse gas emissions can be reduced.
Key points
Australia
- Australia’s climate has warmed by an average of 1.51 ± 0.23 °C since national records began in 1910.
- Sea surface temperatures have increased by an average of 1.08 °C since 1900.
- The warming has led to an increase in the frequency of extreme heat events over land and in the oceans.
- In the south-west of Australia there has been a decrease of around 16% in April to October rainfall since 1970. Across the same region, May to July rainfall has seen the largest reduction, by around 20% since 1970.
- In the south-east of Australia, there has been a decrease of around 9% in April to October rainfall since 1994.
- Heavy short-term rainfall events are becoming more intense.
- There has been a decrease in streamflow at most gauges across Australia since 1970.
- There has been an increase in rainfall and streamflow across parts of northern Australia since the 1970s.
- There has been an increase in extreme fire weather, and a longer fire season, across large parts of the country since the 1950s.
- There has been a decrease in the number of tropical cyclones observed in the Australian region since at least 1982.
- Snow depth, snow cover and number of snow days have decreased in alpine regions since the late 1950s.
- Oceans around Australia are becoming more acidic, with changes happening faster in recent decades.
- Sea levels are rising around Australia, including more frequent extreme high levels that increase the risk of inundation and damage to coastal infrastructure and communities.
Global
- Concentrations of all major long‑lived greenhouse gases in the atmosphere continue to increase. Global annual mean carbon dioxide (CO2) concentrations reached 419.2 parts per million (ppm) in 2023 and the CO2 equivalent (CO2-e) of all greenhouse gases reached 524 ppm. These are the highest levels on Earth in at least 2 million years.
Annual global surface temperature anomalies of the Earth (land and ocean), 1950–2023. Anomalies are relative to the 1961–1990 standard averaging period. Based on data from the World Meteorological Organization. © Bureau of Meteorology - Global fossil fuel CO2 emissions, the principal driver of the growth in CO2 concentrations, are continuing to increase. Overall anthropogenic CO2 emissions, including fossil fuel and land‑use change emissions, have levelled off over the last decade after increasing for more than a century prior to the 2010s.
- In 2022 and 2023, the amounts of methane (CH4) and nitrous oxide (N2O), both greenhouse gases, in the atmosphere increased rapidly.
- Globally averaged air temperature at the Earth’s surface has warmed by about 1.2 °C since reliable records began in 1850. Each decade since 1980 has been warmer than the last, with 2011–2020 being around 0.2 °C warmer than 2001–2010. 2023 was the warmest year on record globally.
- The world’s oceans, especially in the Southern Hemisphere, have taken up more than 90% of the extra energy stored by the planet (as heat) arising from enhanced greenhouse gas concentrations.
Global mean CO2 concentrations and global mean of all greenhouse gas concentrations expressed as CO2-e. - The ice sheets and ice shelves of Antarctica and Greenland are losing ice due to a warmer climate, and contributing to global sea level rise.
- There has been an abrupt decrease in Antarctic sea-ice extent since 2015, after a small increase over the period from 1979 to 2014.
- Around half of all CO2 emissions from human activities are absorbed by land and ocean sinks, which act to slow the rate of increase in atmospheric CO2.
- Global mean sea levels have risen by over 22 cm since 1900; half of this has occurred since 1970.
Future
In the coming decades, Australia will experience ongoing changes to its weather and climate. The changes are projected to include:
- Continued increase in air temperatures, with more heat extremes and fewer cold extremes.
- Continued decrease, on average, in cool season rainfall across many regions of southern and eastern Australia, which will likely lead to more time in drought.
- More intense short-duration heavy rainfall events even in regions where the average rainfall decreases or stays the same.
- Continued increase in the number of dangerous fire weather days and a longer fire season for much of southern and eastern Australia.
- Further sea level rise and continued warming and acidification of the oceans around Australia.
- Increased and longer-lasting marine heatwaves that will affect marine environments such as kelp forests and increase the likelihood of more frequent and severe bleaching events in coral reefs around Australia, including the Great Barrier Reef and Ningaloo Reef.
- Fewer tropical cyclones, but with higher intensity on average, and greater impacts when they occur through higher rain rates and higher sea level.
- Reduced average snow depth in alpine regions, but with variations from year to year.