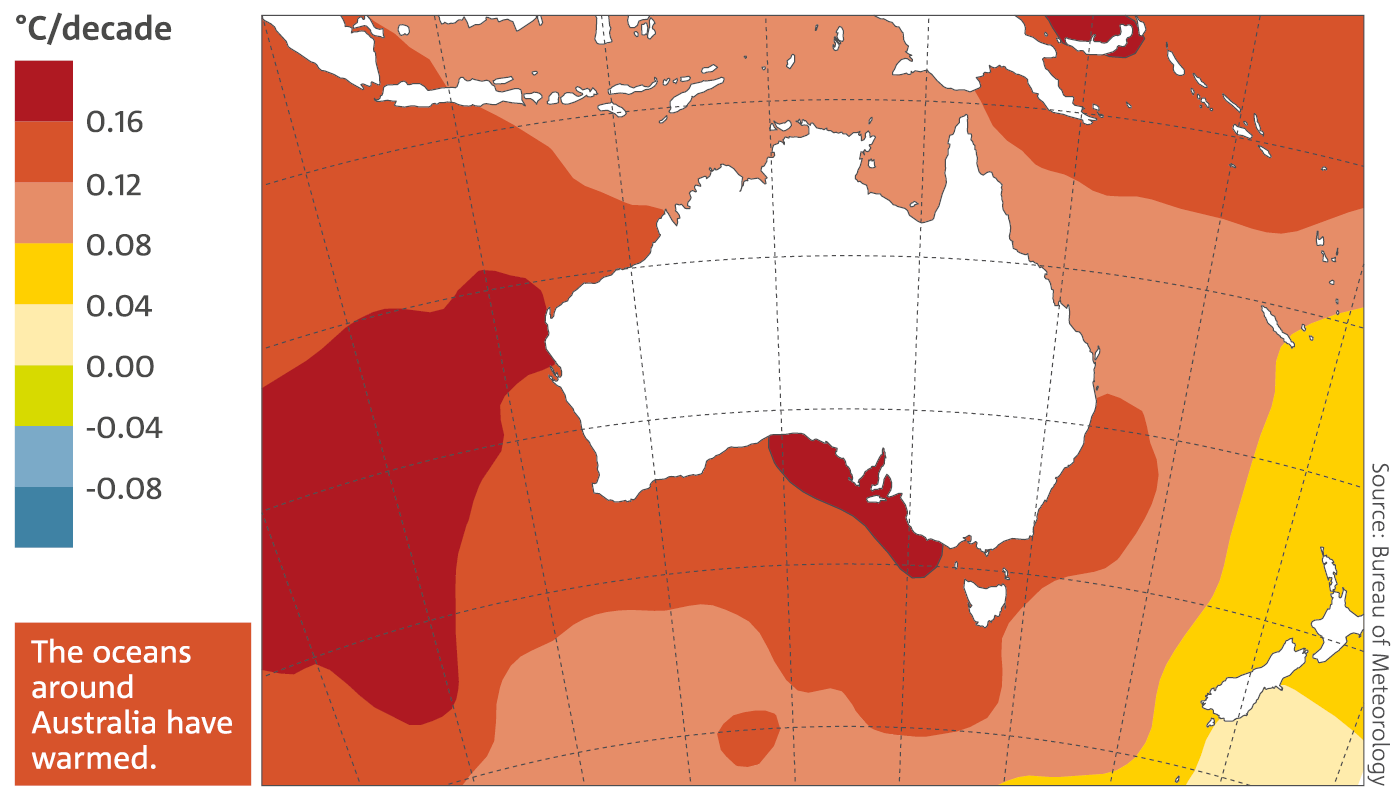
The oceans surrounding Australia have warmed, with the greatest surface warming to the west and south of the continent. As in the atmosphere, favourable conditions for marine heatwaves around Australia can occur due to natural variability, such as the warmer Pacific Ocean waters brought to our region by La Niña. However, attribution studies have shown that background warming of the global oceans has led to a greater prevalence of marine heatwaves. In recent years, major heat events have occurred to the west of Australia, off Tasmania’s east coast and, with the 2015–16 El Niño, in the Coral Sea.
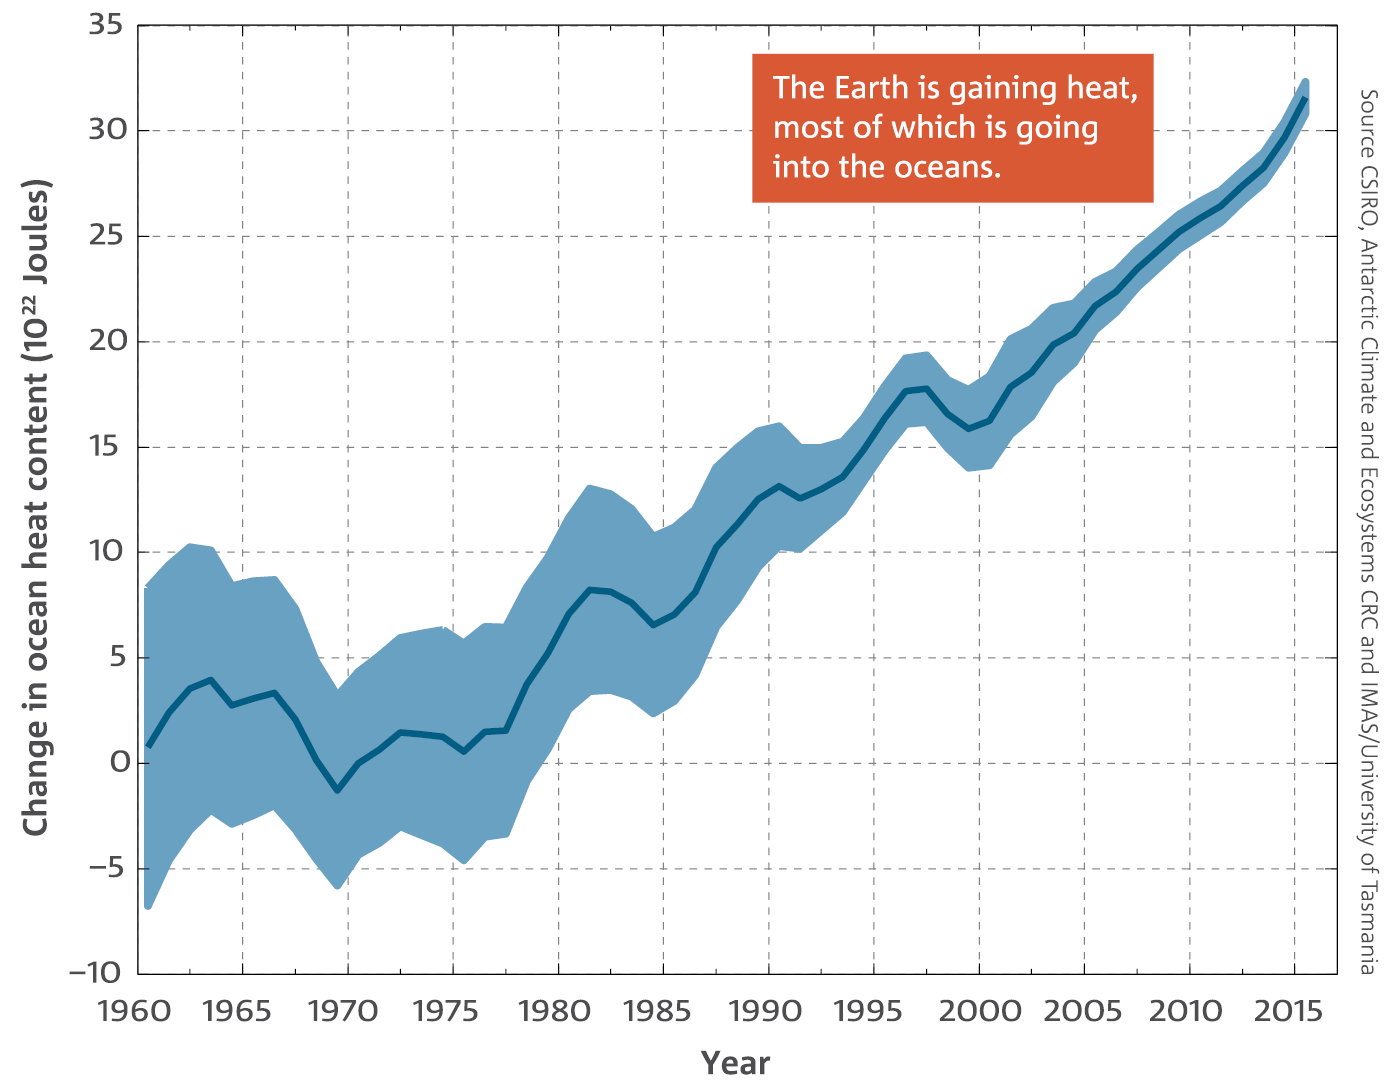
Oceans play a critical role in the climate system—the world’s oceans absorb more than 90 per cent of the additional energy arising from the enhanced greenhouse effect, resulting in increases in ocean heat content. Ocean heat content is less variable than surface temperature and is a more reliable measure of the additional heat in the climate system. Our ability to monitor the ocean has been greatly enhanced in the last ten years, with the deployment of thousands of robotic submersible floats worldwide, as part of the international Argo program.
Ocean observations, including Argo with its short but growing record of near-global ocean observations including the deep ocean, show conclusively that ocean heat content has risen steadily, and there is an overall energy imbalance at the Earth’s surface of 0.65–0.80 Wm-2, averaged over the surface of the Earth. Around 80 per cent of the additional energy accumulated by the climate system is accounted for by the warming of the upper 2000 m of the ocean. At least 75 per cent of the ocean warming occurred in the southern hemisphere, predominantly between latitudes 30° S and 50° S.
As with temperatures over land, global ocean temperatures (particularly the upper 300 m) show shorter-term variability, on top of the long-term change. For instance, the global surface ocean temperatures were relatively cool following the strong La Niña of 2010, but became warmer with the 2015–16 El Niño. Temperatures at depth are not influenced by this variability and are increasing steadily.
Sea level
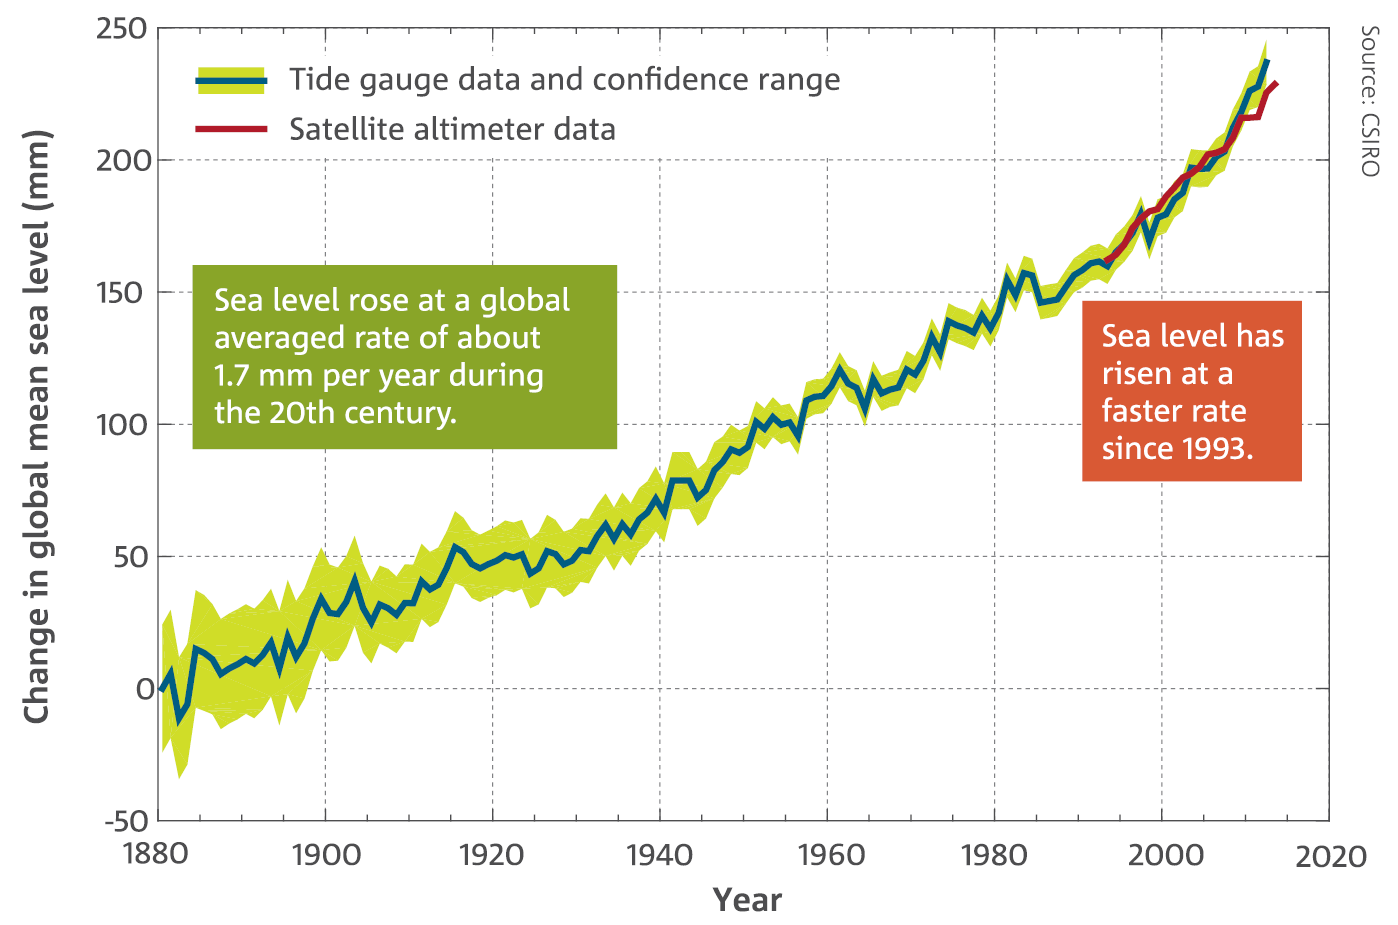
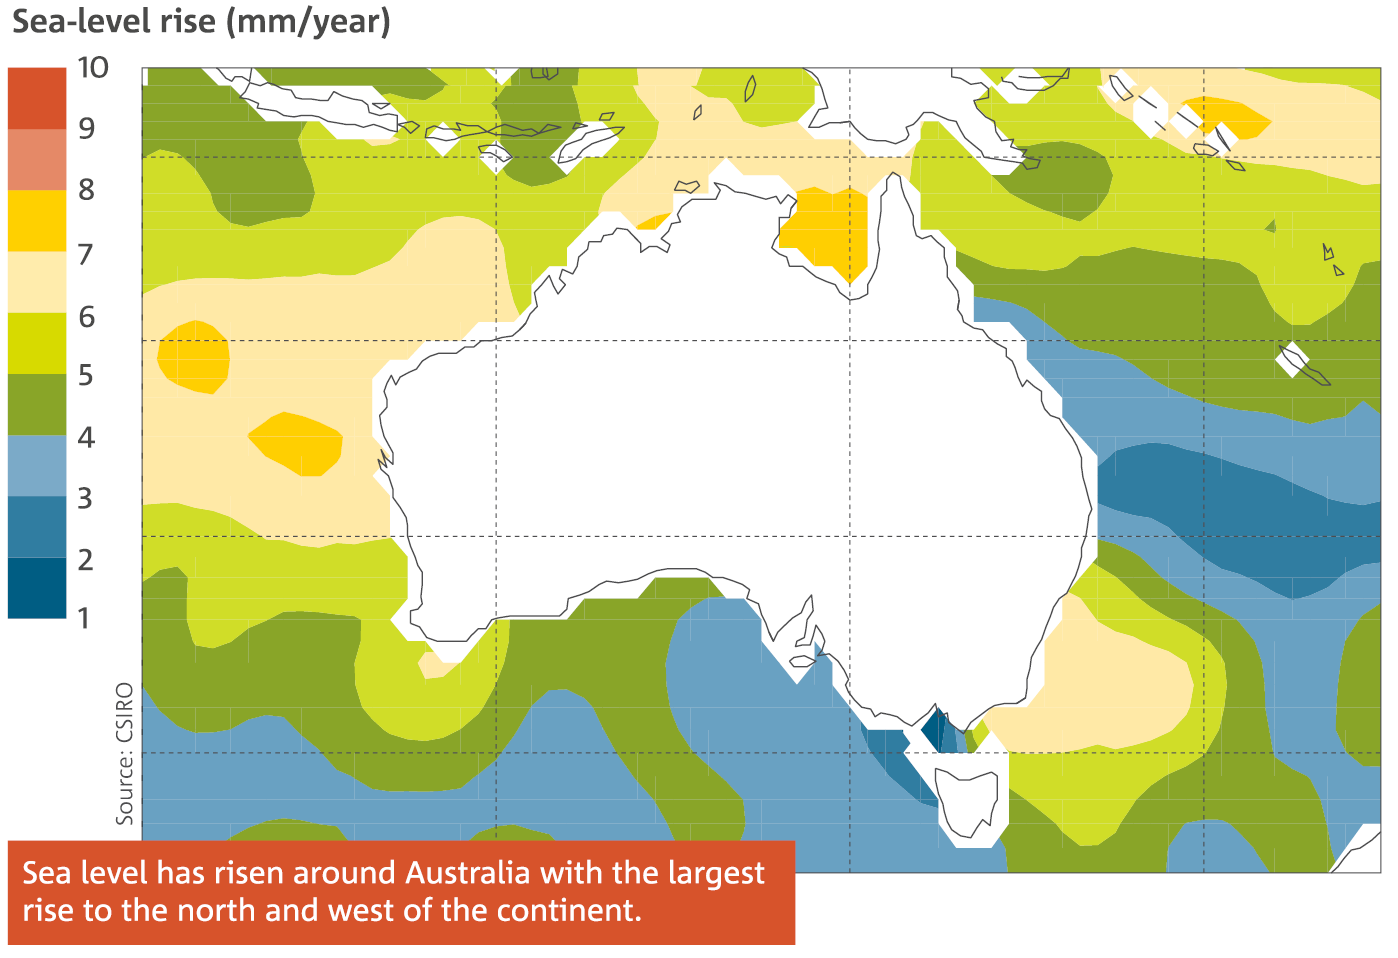
As oceans warm, they expand and sea level rises. Ocean warming has contributed about a third of the observed global sea-level rise of over 20 cm since the late 19th century. The remainder comes from the loss of ice from glaciers and polar ice sheets, and changes in the amount of water stored on the land. Since 1993, the rates of sea-level rise to the north, west and southeast of Australia have been higher than the global average, and rates of sea-level rise on the central east and southern coasts of the continent have been closer to the global average.
Ocean acidification
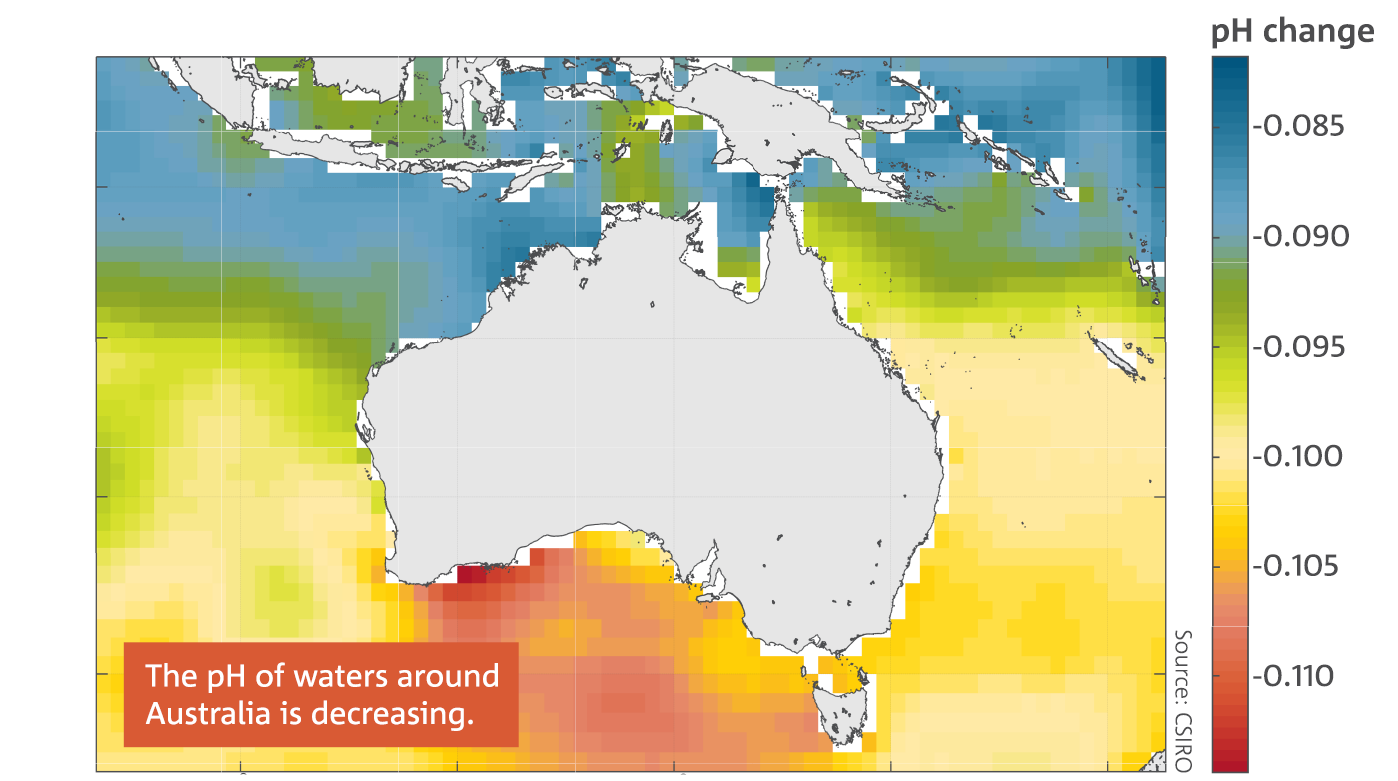
The atmospheric CO2 taken up by the ocean reacts in seawater causing a decrease in seawater pH or an increased level of acidity (i.e. the waters are less ‘basic’). Ocean acidification can affect the entire marine biosphere, although not all species are susceptible. In general, marine species that produce shells or skeletons of calcium carbonate, like corals and shellfish, are susceptible to increasing acidity levels, particularly in early life stages. The average pH of surface waters around Australia is estimated to have decreased between 1880–89 and 2000–09 by about 0.1, corresponding to a 25 per cent increase in the concentration of hydrogen ions. Seas to the south of Australia have a slightly greater ocean acidification change than those to the north.
Cryosphere
Melting of the Greenland ice sheet has increased dramatically over the last 25 years, with the rate increasing from 34 Gt (billion tonnes) per year during 1992–2001 to 215 Gt per year over 2002–11. The meltwater contributes to sea-level rise. Changes have also been observed in the ice sheets and ice shelves around Antarctica, with outlet glaciers retreating in West Antarctica and melting of the underside of ice-shelves to the west of the Antarctic Peninsula. In Antarctica, ice shelves on the coastal waters are a major control on the rate of loss of land-based ice from the Antarctic continent. Warm ocean water penetrating below the ice shelves of the West Antarctic ice sheet is destabilising a number of outlet glaciers, increasing the Antarctic contribution to sea-level rise.
In contrast, sea-ice changes have little impact on sea level. Sea-ice is merely frozen sea water that floats. When it melts, it returns the original volume of water to the sea. However, the presence or absence of sea-ice can influence the climate and also be an indicator of wider climate changes. The sea-ice extent in the Arctic Ocean has decreased 3.5–4.1 per cent per decade since satellite records began in 1979. The lowest winter maximum extent on record was observed in 2015, and the summer sea-ice extent was the fourth smallest.
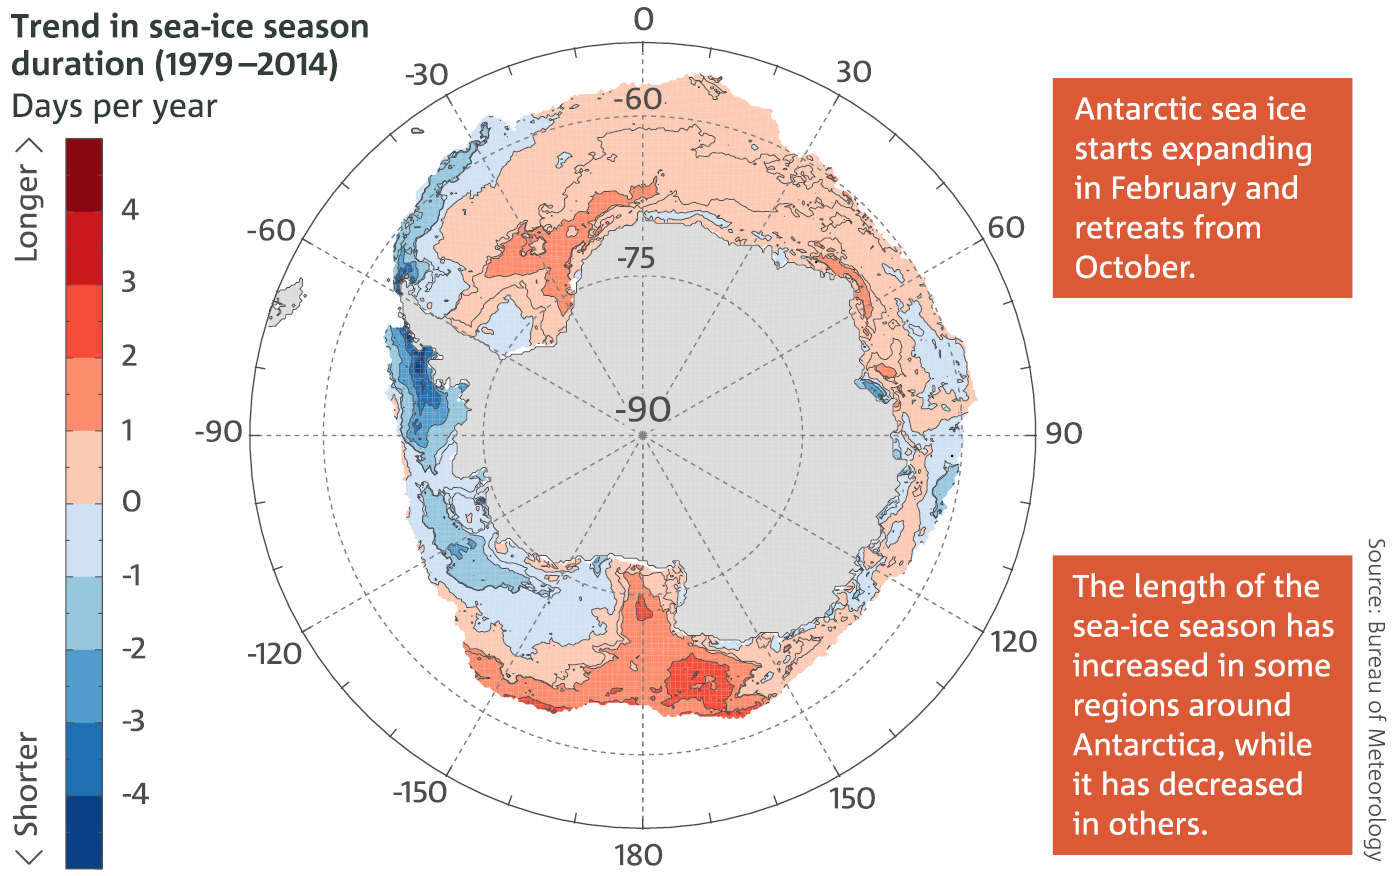
In Antarctica, sea-ice has seen statistically significant increases of extent and season duration in some regions (particularly in the Ross Sea region, at about 170 degrees of longitude) and decreases in others (particularly to the west of the Antarctic Peninsula in the Bellingshausen Sea). The duration of the sea-ice season has changed by up to four months over the 36 years of sea-ice records in these regions. These trends are a result of many factors including changes in winds over the Southern Ocean and near the Antarctic continent, and changes in ocean surface temperature and salinity.
The oceans surrounding Australia have warmed, with the greatest surface warming to the west and south of the continent. As in the atmosphere, favourable conditions for marine heatwaves around Australia can occur due to natural variability, such as the warmer Pacific Ocean waters brought to our region by La Niña. However, attribution studies have shown that background warming of the global oceans has led to a greater prevalence of marine heatwaves. In recent years, major heat events have occurred to the west of Australia, off Tasmania’s east coast and, with the 2015–16 El Niño, in the Coral Sea.
Oceans play a critical role in the climate system—the world’s oceans absorb more than 90 per cent of the additional energy arising from the enhanced greenhouse effect, resulting in increases in ocean heat content. Ocean heat content is less variable than surface temperature and is a more reliable measure of the additional heat in the climate system. Our ability to monitor the ocean has been greatly enhanced in the last ten years, with the deployment of thousands of robotic submersible floats worldwide, as part of the international Argo program.
Ocean observations, including Argo with its short but growing record of near-global ocean observations including the deep ocean, show conclusively that ocean heat content has risen steadily, and there is an overall energy imbalance at the Earth’s surface of 0.65–0.80 Wm-2, averaged over the surface of the Earth. Around 80 per cent of the additional energy accumulated by the climate system is accounted for by the warming of the upper 2000 m of the ocean. At least 75 per cent of the ocean warming occurred in the southern hemisphere, predominantly between latitudes 30° S and 50° S.
As with temperatures over land, global ocean temperatures (particularly the upper 300 m) show shorter-term variability, on top of the long-term change. For instance, the global surface ocean temperatures were relatively cool following the strong La Niña of 2010, but became warmer with the 2015–16 El Niño. Temperatures at depth are not influenced by this variability and are increasing steadily.
Sea level
As oceans warm, they expand and sea level rises. Ocean warming has contributed about a third of the observed global sea-level rise of over 20 cm since the late 19th century. The remainder comes from the loss of ice from glaciers and polar ice sheets, and changes in the amount of water stored on the land. Since 1993, the rates of sea-level rise to the north, west and southeast of Australia have been higher than the global average, and rates of sea-level rise on the central east and southern coasts of the continent have been closer to the global average.
Ocean acidification
The atmospheric CO2 taken up by the ocean reacts in seawater causing a decrease in seawater pH or an increased level of acidity (i.e. the waters are less ‘basic’). Ocean acidification can affect the entire marine biosphere, although not all species are susceptible. In general, marine species that produce shells or skeletons of calcium carbonate, like corals and shellfish, are susceptible to increasing acidity levels, particularly in early life stages. The average pH of surface waters around Australia is estimated to have decreased between 1880–89 and 2000–09 by about 0.1, corresponding to a 25 per cent increase in the concentration of hydrogen ions. Seas to the south of Australia have a slightly greater ocean acidification change than those to the north.
Cryosphere
Melting of the Greenland ice sheet has increased dramatically over the last 25 years, with the rate increasing from 34 Gt (billion tonnes) per year during 1992–2001 to 215 Gt per year over 2002–11. The meltwater contributes to sea-level rise. Changes have also been observed in the ice sheets and ice shelves around Antarctica, with outlet glaciers retreating in West Antarctica and melting of the underside of ice-shelves to the west of the Antarctic Peninsula. In Antarctica, ice shelves on the coastal waters are a major control on the rate of loss of land-based ice from the Antarctic continent. Warm ocean water penetrating below the ice shelves of the West Antarctic ice sheet is destabilising a number of outlet glaciers, increasing the Antarctic contribution to sea-level rise.
In contrast, sea-ice changes have little impact on sea level. Sea-ice is merely frozen sea water that floats. When it melts, it returns the original volume of water to the sea. However, the presence or absence of sea-ice can influence the climate and also be an indicator of wider climate changes. The sea-ice extent in the Arctic Ocean has decreased 3.5–4.1 per cent per decade since satellite records began in 1979. The lowest winter maximum extent on record was observed in 2015, and the summer sea-ice extent was the fourth smallest.
In Antarctica, sea-ice has seen statistically significant increases of extent and season duration in some regions (particularly in the Ross Sea region, at about 170 degrees of longitude) and decreases in others (particularly to the west of the Antarctic Peninsula in the Bellingshausen Sea). The duration of the sea-ice season has changed by up to four months over the 36 years of sea-ice records in these regions. These trends are a result of many factors including changes in winds over the Southern Ocean and near the Antarctic continent, and changes in ocean surface temperature and salinity.