Blog icon

This fourth, biennial State of the Climate report draws on the latest monitoring, science and projection information to describe variability and changes in Australia’s climate, and how it is likely to change in the future. Observations and climate modelling paint a consistent picture of ongoing, long-term climate change interacting with underlying natural variability.

These changes affect many Australians, particularly changes associated with increases in the frequency or intensity of heat events, fire weather and drought. Australia will need to plan for and adapt to some level of climate change. This report is a synthesis of the science informing our understanding of climate in Australia, and includes new information about Australia's climate of the past, present and future. The science underpinning this report will help inform a range of economic, environmental and social decision-making and local vulnerability assessments, by government, industry and communities.
Key points

Australia

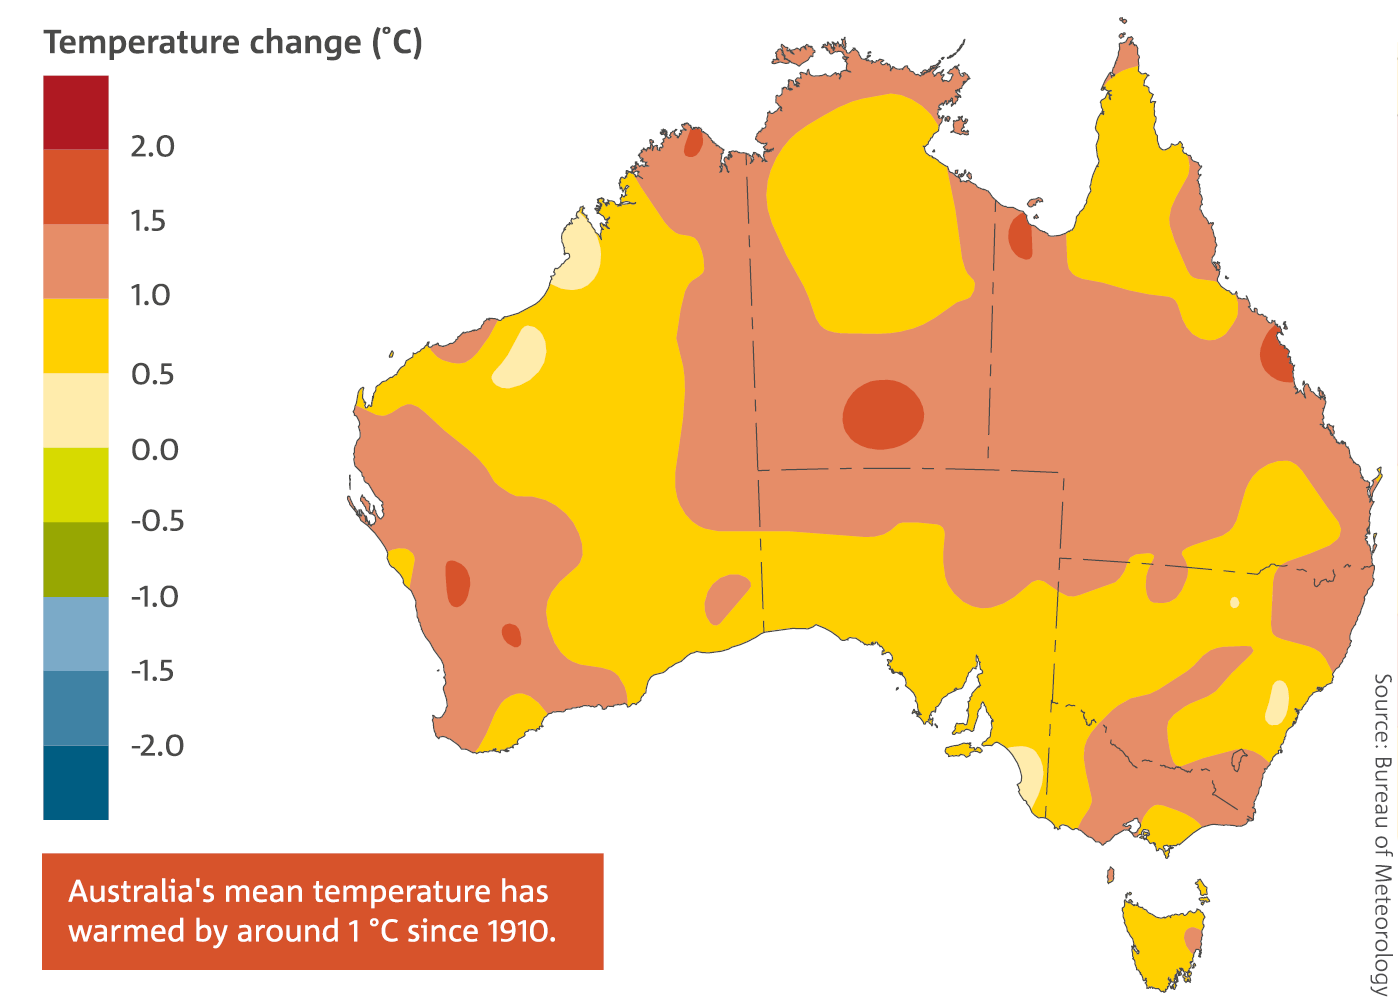
  • Australia’s climate has warmed in both mean surface air temperature and surrounding sea surface temperature by around 1 °C since 1910.
  • The duration, frequency and intensity of extreme heat events have increased across large parts of Australia.
  • There has been an increase in extreme fire weather, and a longer fire season, across large parts of Australia since the 1970s.
  • May–July rainfall has reduced by around 19 per cent since 1970 in the southwest of Australia.
  • There has been a decline of around 11 per cent since the mid-1990s in the April–October growing season rainfall in the continental southeast.
  • Rainfall has increased across parts of northern Australia since the 1970s.
  • Oceans around Australia have warmed and ocean acidity levels have increased.
  • Sea levels have risen around Australia. The rise in mean sea level amplifies the effects of high tides and storm surges.

Map: Annual mean temperature changes across Australia since 1910. Australia's mean temperature has warmed by around 1 °C since 1910.

Global

  • Global average annual carbon dioxide (CO2) levels are steadily increasing; they reached 399 parts per million (ppm) in 2015, and the annual value for 2016 is almost certain to be higher than 400 ppm. Current levels are likely the highest in the past two million years.
  • 2015 was the warmest year on record for the globe since reliable global surface air temperature records began in 1880. The last 15 years are among the 16 warmest years on record.
  • Globally-averaged ocean temperatures and heat content are increasing. Observations reveal this warming extends to at least 2000 m below the surface.
  • Globally-averaged sea level has risen over 20 cm since the late 19th century, with about one third of this rise due to ocean warming and the rest from melting land ice and changes in the amount of water stored on the land.

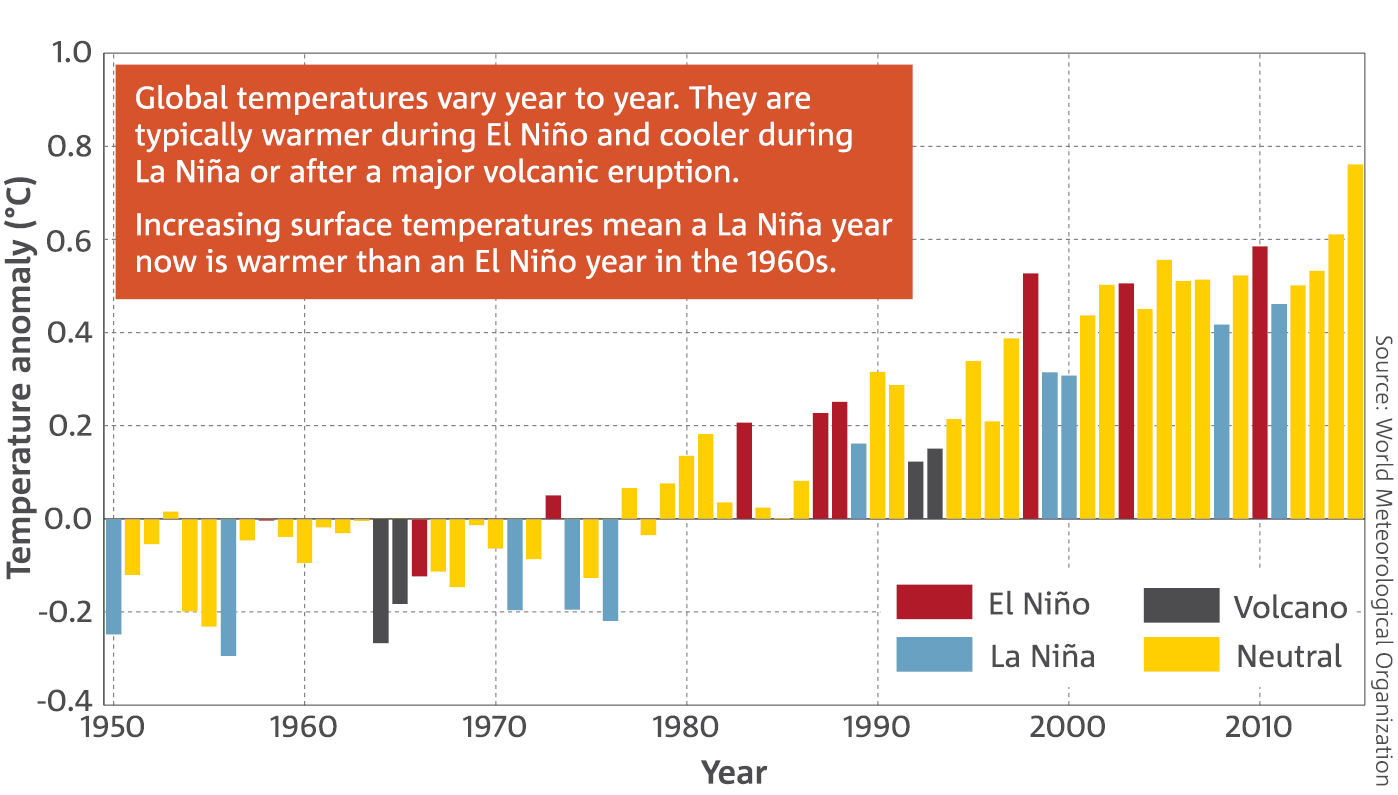
Bar chart: Global surface temperature anomalies of the Earth (land and ocean) for 1950–2015. Global temperatures vary year to year. They are typically warmer during El Niño and cooler during La Niña or after a major volcanic eruption.   Increasing surface temperatures mean a La Niña year now is warmer than an El Niño year in the 1960s.

Future

  • Australian temperatures are projected to continue increasing with more extremely hot days and fewer extremely cool days.
  • The number of days with weather conducive to fire in southern and eastern Australia is projected to increase.
  • Winter and spring rainfall is projected to decrease across southern continental Australia, with more time spent in drought.
  • Past and ongoing greenhouse gas emissions mean further warming of ocean temperatures.
  • Sea-level rise and ocean acidification around Australia are projected to continue.

This fourth, biennial State of the Climate report draws on the latest monitoring, science and projection information to describe variability and changes in Australia’s climate, and how it is likely to change in the future. Observations and climate modelling paint a consistent picture of ongoing, long-term climate change interacting with underlying natural variability.

These changes affect many Australians, particularly changes associated with increases in the frequency or intensity of heat events, fire weather and drought. Australia will need to plan for and adapt to some level of climate change. This report is a synthesis of the science informing our understanding of climate in Australia, and includes new information about Australia's climate of the past, present and future. The science underpinning this report will help inform a range of economic, environmental and social decision-making and local vulnerability assessments, by government, industry and communities.

Key points

Australia

  • Australia’s climate has warmed in both mean surface air temperature and surrounding sea surface temperature by around 1 °C since 1910.
  • The duration, frequency and intensity of extreme heat events have increased across large parts of Australia.
  • There has been an increase in extreme fire weather, and a longer fire season, across large parts of Australia since the 1970s.
  • May–July rainfall has reduced by around 19 per cent since 1970 in the southwest of Australia.
  • There has been a decline of around 11 per cent since the mid-1990s in the April–October growing season rainfall in the continental southeast.
  • Rainfall has increased across parts of northern Australia since the 1970s.
  • Oceans around Australia have warmed and ocean acidity levels have increased.
  • Sea levels have risen around Australia. The rise in mean sea level amplifies the effects of high tides and storm surges.

Annual mean temperature changes across Australia since 1910. ©  Bureau of Meteorology

Global

  • Global average annual carbon dioxide (CO2) levels are steadily increasing; they reached 399 parts per million (ppm) in 2015, and the annual value for 2016 is almost certain to be higher than 400 ppm. Current levels are likely the highest in the past two million years.
  • 2015 was the warmest year on record for the globe since reliable global surface air temperature records began in 1880. The last 15 years are among the 16 warmest years on record.
  • Globally-averaged ocean temperatures and heat content are increasing. Observations reveal this warming extends to at least 2000 m below the surface.
  • Globally-averaged sea level has risen over 20 cm since the late 19th century, with about one third of this rise due to ocean warming and the rest from melting land ice and changes in the amount of water stored on the land.

Global surface temperature anomalies of the Earth (land and ocean) for 1950–2015. Anomalies are with respect to the 1961–1990 base period. Major tropical volcanic eruptions are associated with cooler global temperatures. El Niño and La Niña events typically develop in winter to spring and decline the following autumn. For strong events, the response in global temperature is greatest in the latter part of an event and thus the year following the start of the event is highlighted. For example, the warming associated with the 1997–98 El Niño led to high mean global temperatures in 1998 (the warmest year for the 20th century). Neutral years are those years with no moderate or strong El Niño or La Niña events occurring. Data from World Meteorological Organization

Future

  • Australian temperatures are projected to continue increasing with more extremely hot days and fewer extremely cool days.
  • The number of days with weather conducive to fire in southern and eastern Australia is projected to increase.
  • Winter and spring rainfall is projected to decrease across southern continental Australia, with more time spent in drought.
  • Past and ongoing greenhouse gas emissions mean further warming of ocean temperatures.
  • Sea-level rise and ocean acidification around Australia are projected to continue.

Contact us

Find out how we can help you and your business. Get in touch using the form below and our experts will get in contact soon!

CSIRO will handle your personal information in accordance with the Privacy Act 1988 (Cth) and our Privacy Policy.


First name must be filled in

Surname must be filled in

I am representing *

Please choose an option

Please provide a subject for the enquriy

0 / 100

We'll need to know what you want to contact us about so we can give you an answer

0 / 1900

You shouldn't be able to see this field. Please try again and leave the field blank.