Temperature
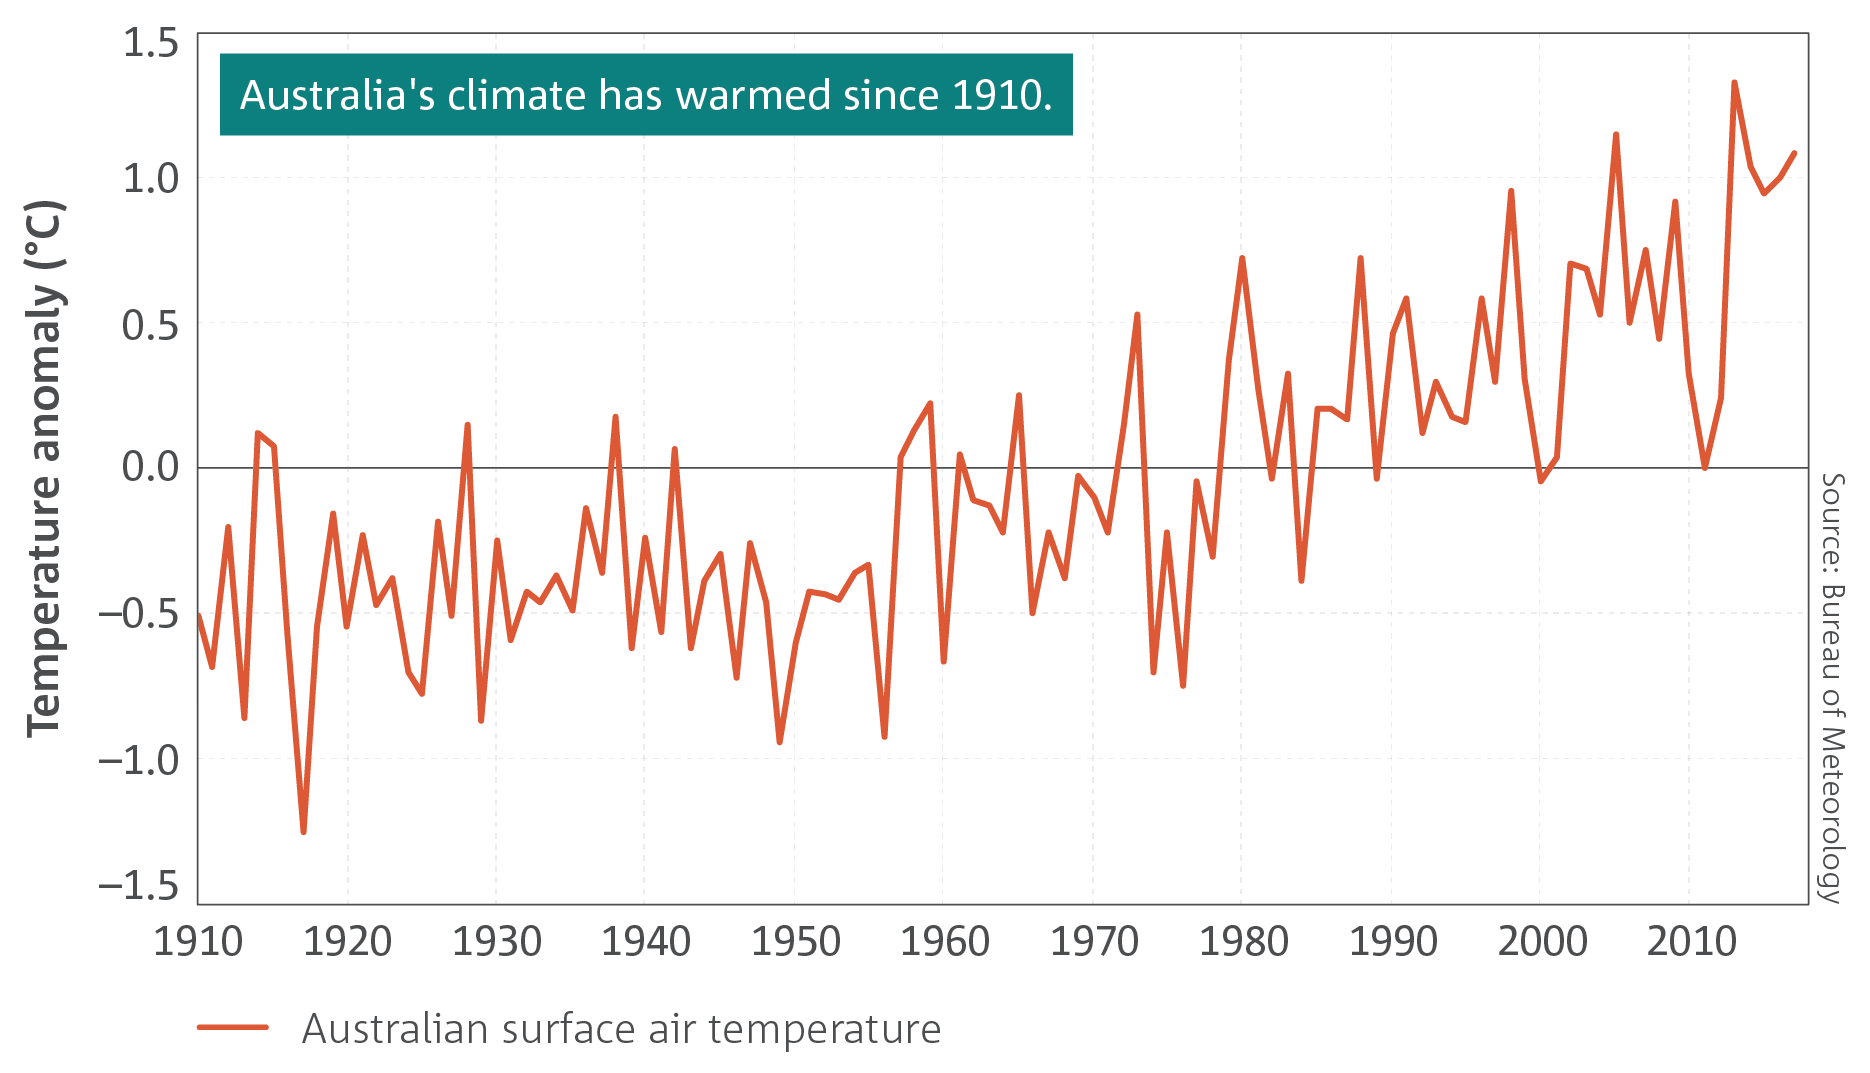
- Australia’s climate has warmed by just over 1 °C since 1910, leading to an increase in the frequency of extreme heat events.
Australia’s weather and climate continues to change in response to a warming global climate. Australia has warmed by just over 1 °C since 1910, with most warming since 1950. This warming has seen an increase in the frequency of extreme heat events and increased the severity of drought conditions during periods of below-average rainfall. Eight of Australia’s top ten 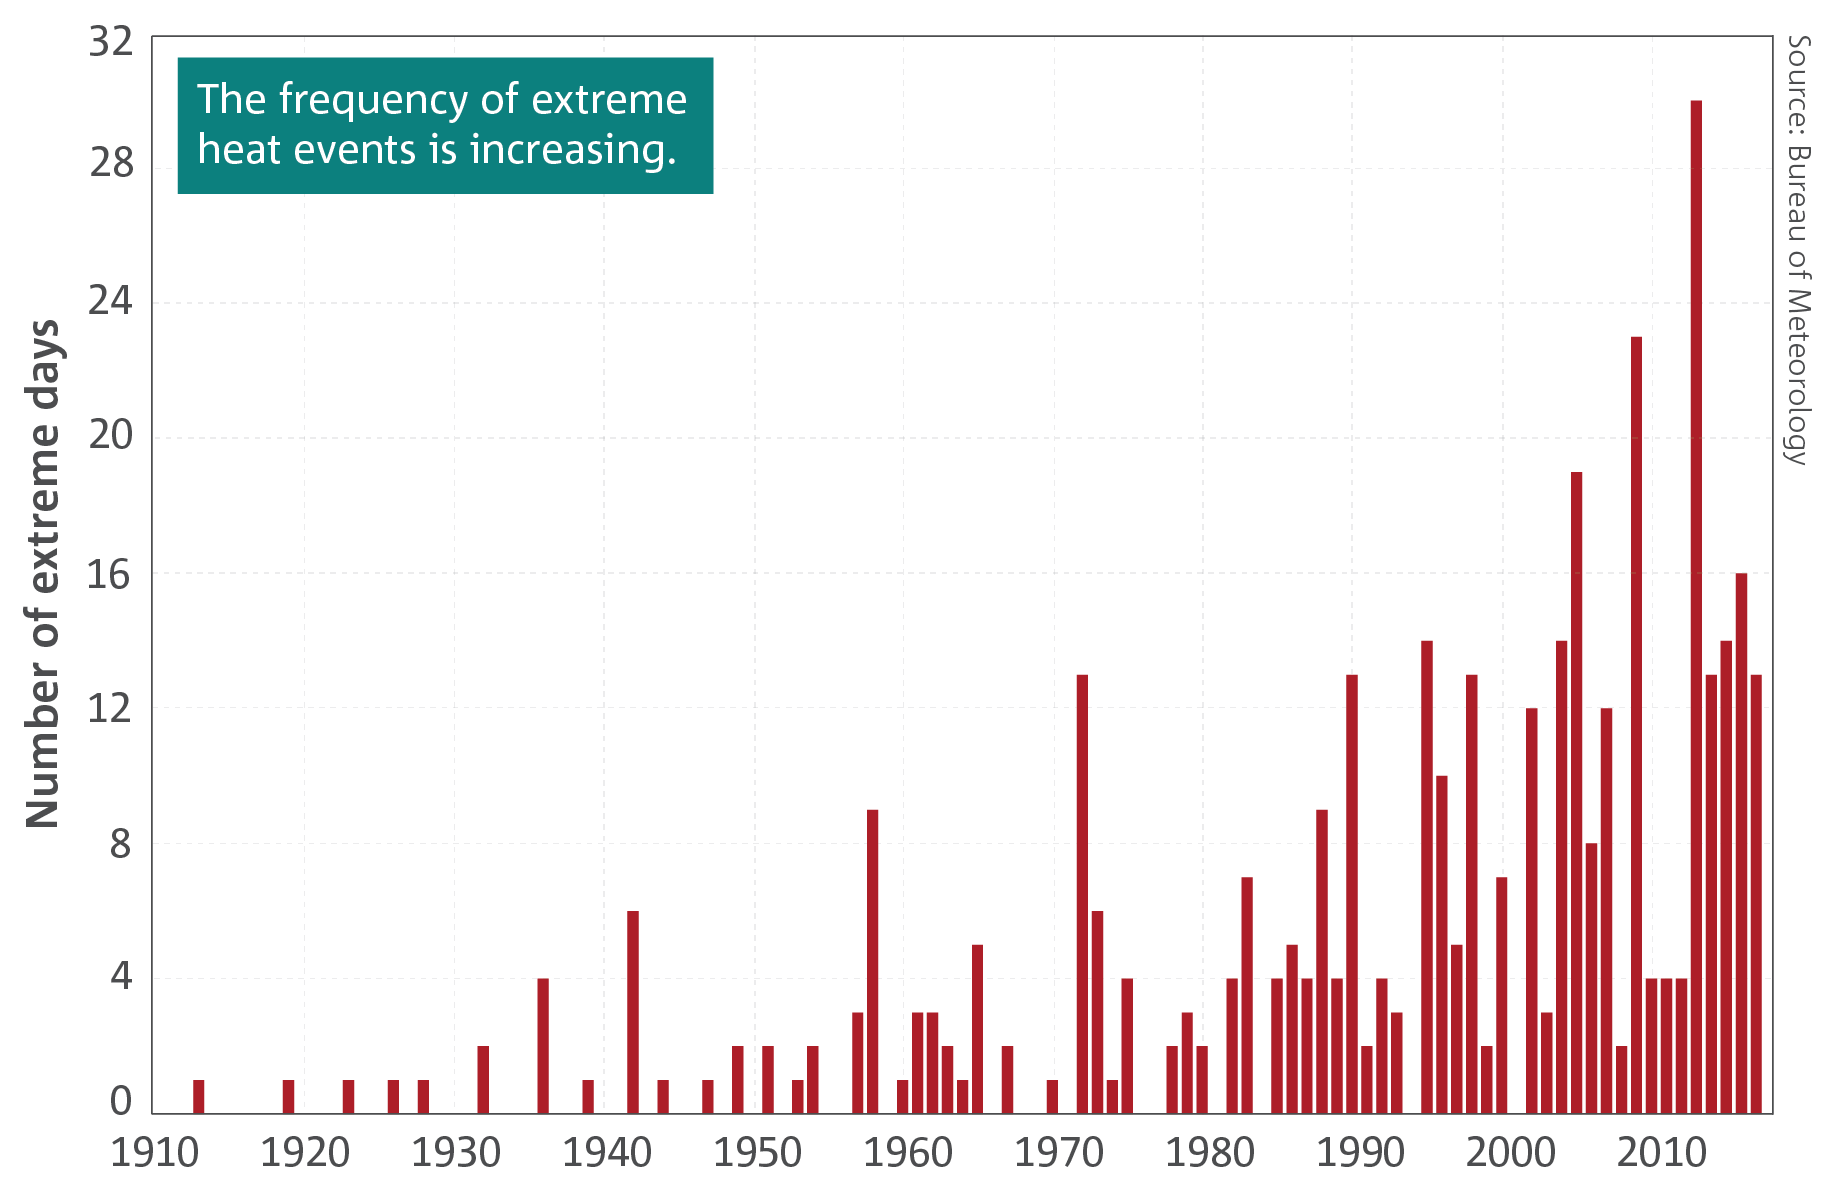 warmest years on record have occurred since 2005.
The year-to-year changes in Australia’s climate are mostly associated with natural climate variability such as El Niño and La Niña in the tropical Pacific Ocean and phases of the Indian Ocean Dipole in the Indian Ocean. This natural variability now occurs on top of the warming trend, which can modify the impact of these natural drivers on the Australian climate.
Increases in temperature are observed across Australia in all seasons with both day and night-time temperatures showing warming. The shift to a warmer climate in Australia is accompanied by more extreme daily heat events. Record-warm monthly and seasonal temperatures have been observed in recent years, made more likely by climate change.
Examining the shift in the distributions of monthly day and night-time temperature shows that very high monthly maximum temperatures that occurred around 2 per cent of the time in the past (1951–1980) now occur around 12 per cent of the time (2003–2017). Very warm monthly minimum, or night-time, temperatures that occurred around 2 per cent of the time in the past (1951–1980) now also occur around 12 per cent of the time (2003–2017). This upward shift in the distributions of temperature has occurred across all seasons, with the largest change in spring. 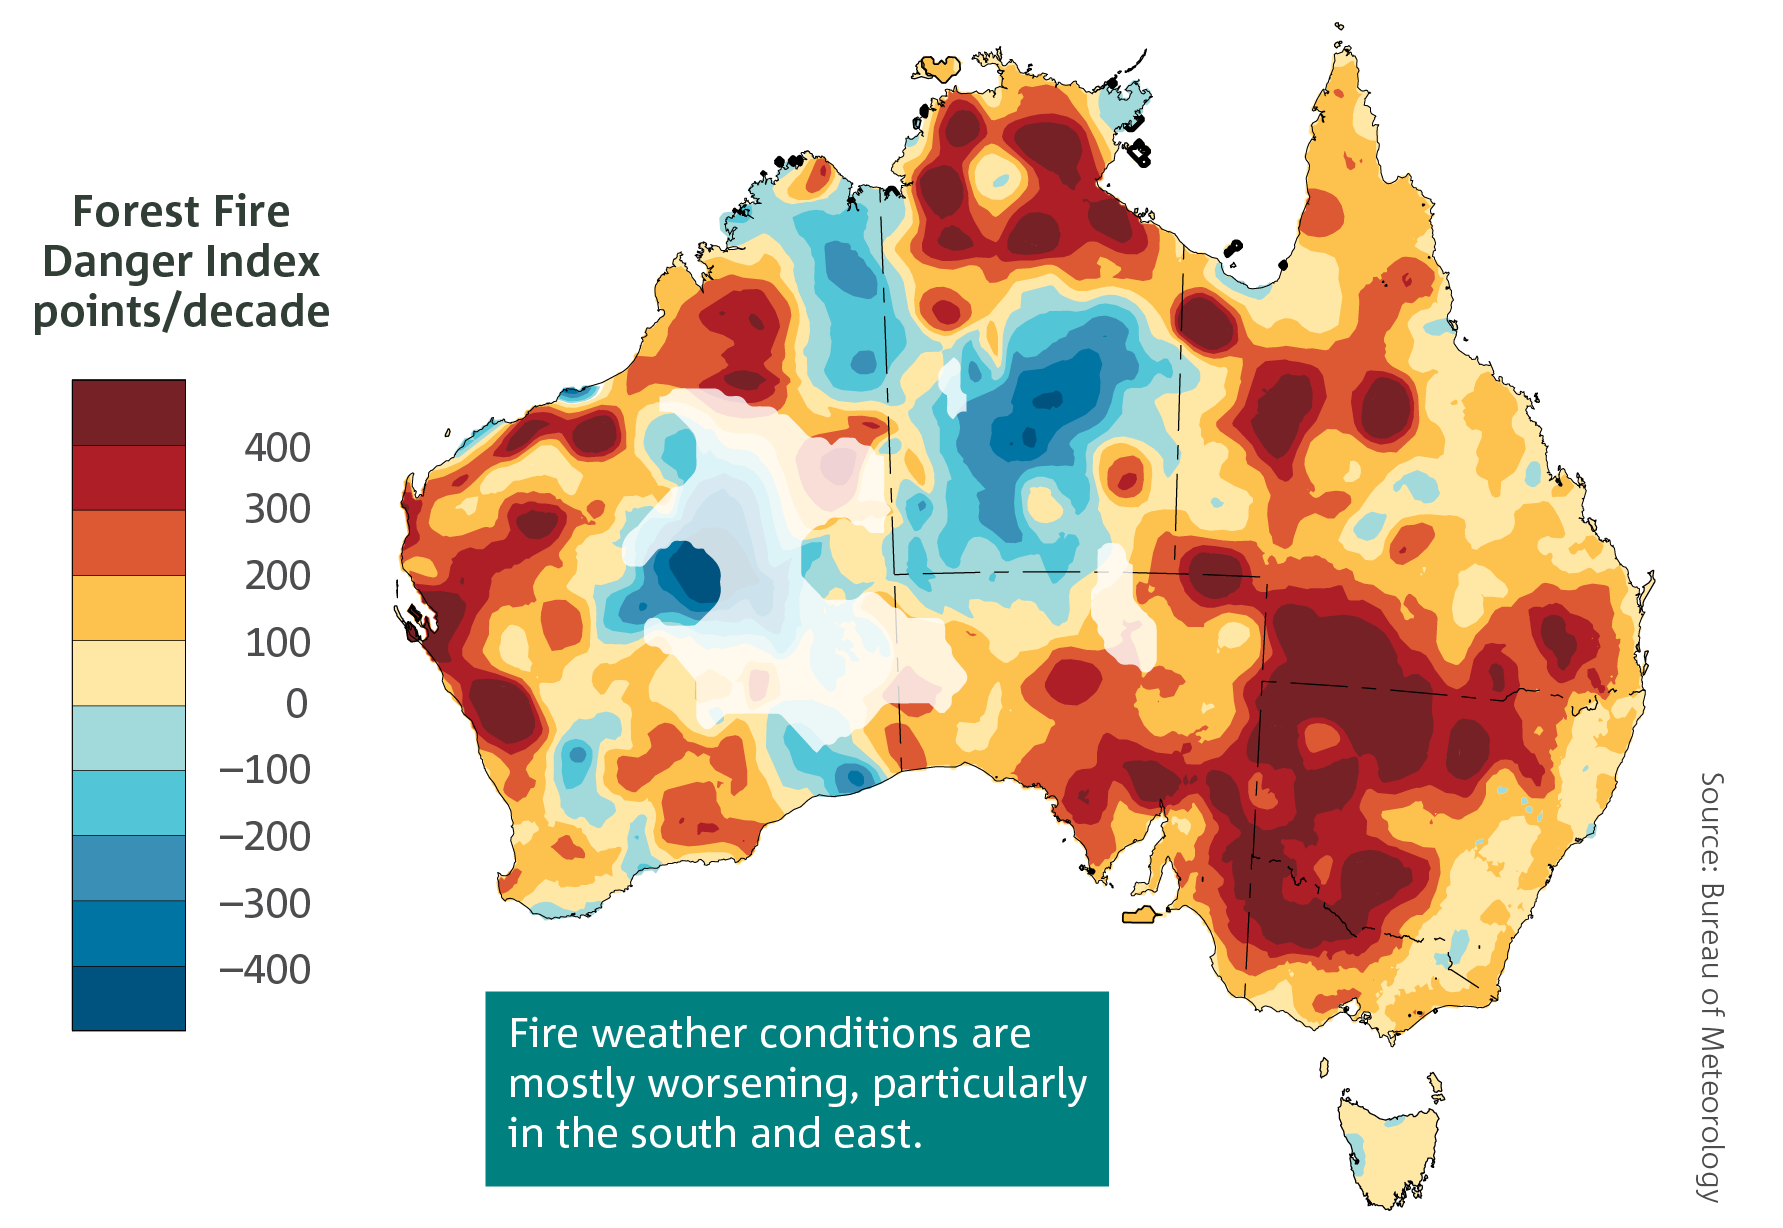
Fire weather
- There has been a long-term increase in extreme fire weather and in the length of the fire season across large parts of Australia since the 1950s.
Fire weather is largely monitored in Australia using the Forest Fire Danger Index (FFDI). This index estimates the fire danger on a given day based on observations of temperature, rainfall, humidity and wind speed. The annual 90th percentile of daily FFDI (i.e., the most extreme 10 per cent of fire weather days) has increased in recent decades across many regions of Australia, especially in southern and eastern Australia. There has been an associated increase in the length of the fire weather season. Climate change, including increasing temperatures, is contributing to these changes. Considerable year-to-year variability also occurs, with La Niña years, for example 2010–2011 and 1999–2000, generally associated with a lower number of days with high FFDI values.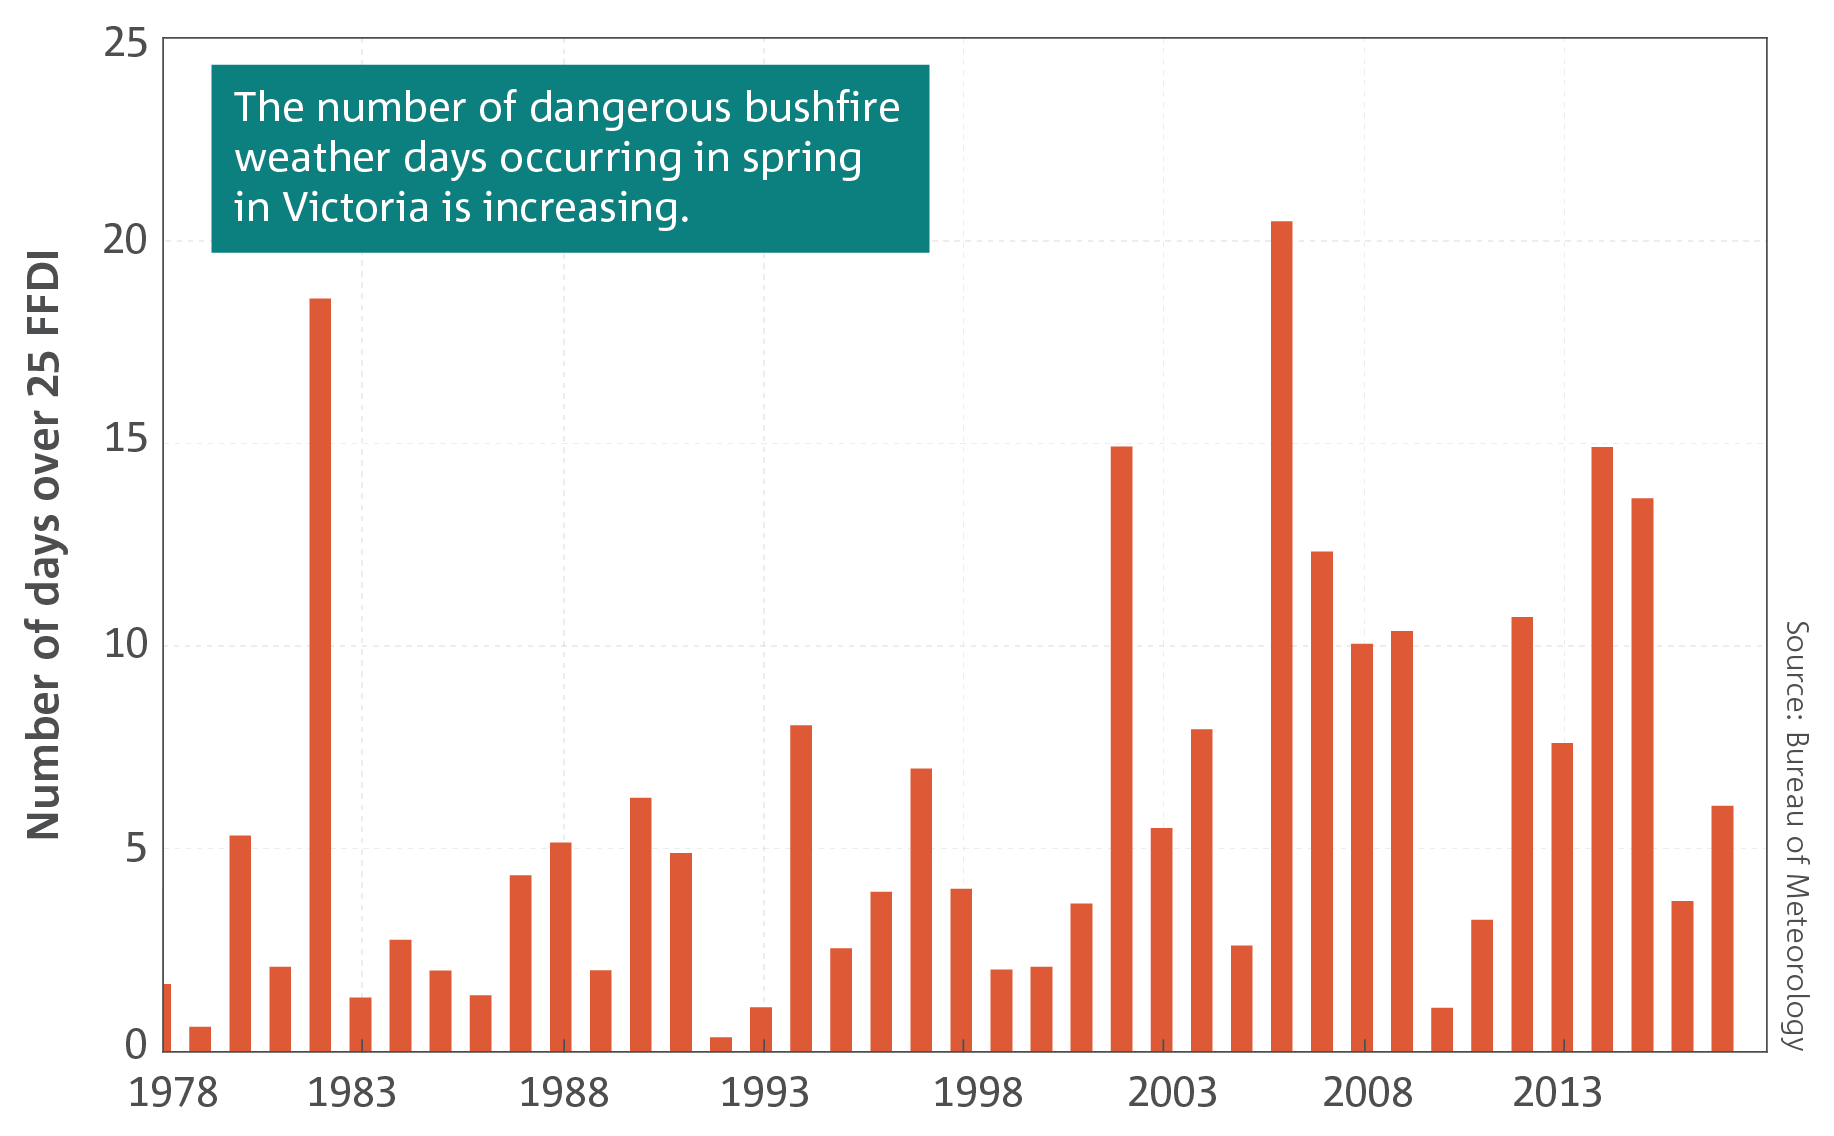
Rainfall
- April to October rainfall across southeastern and southwestern Australia has declined.
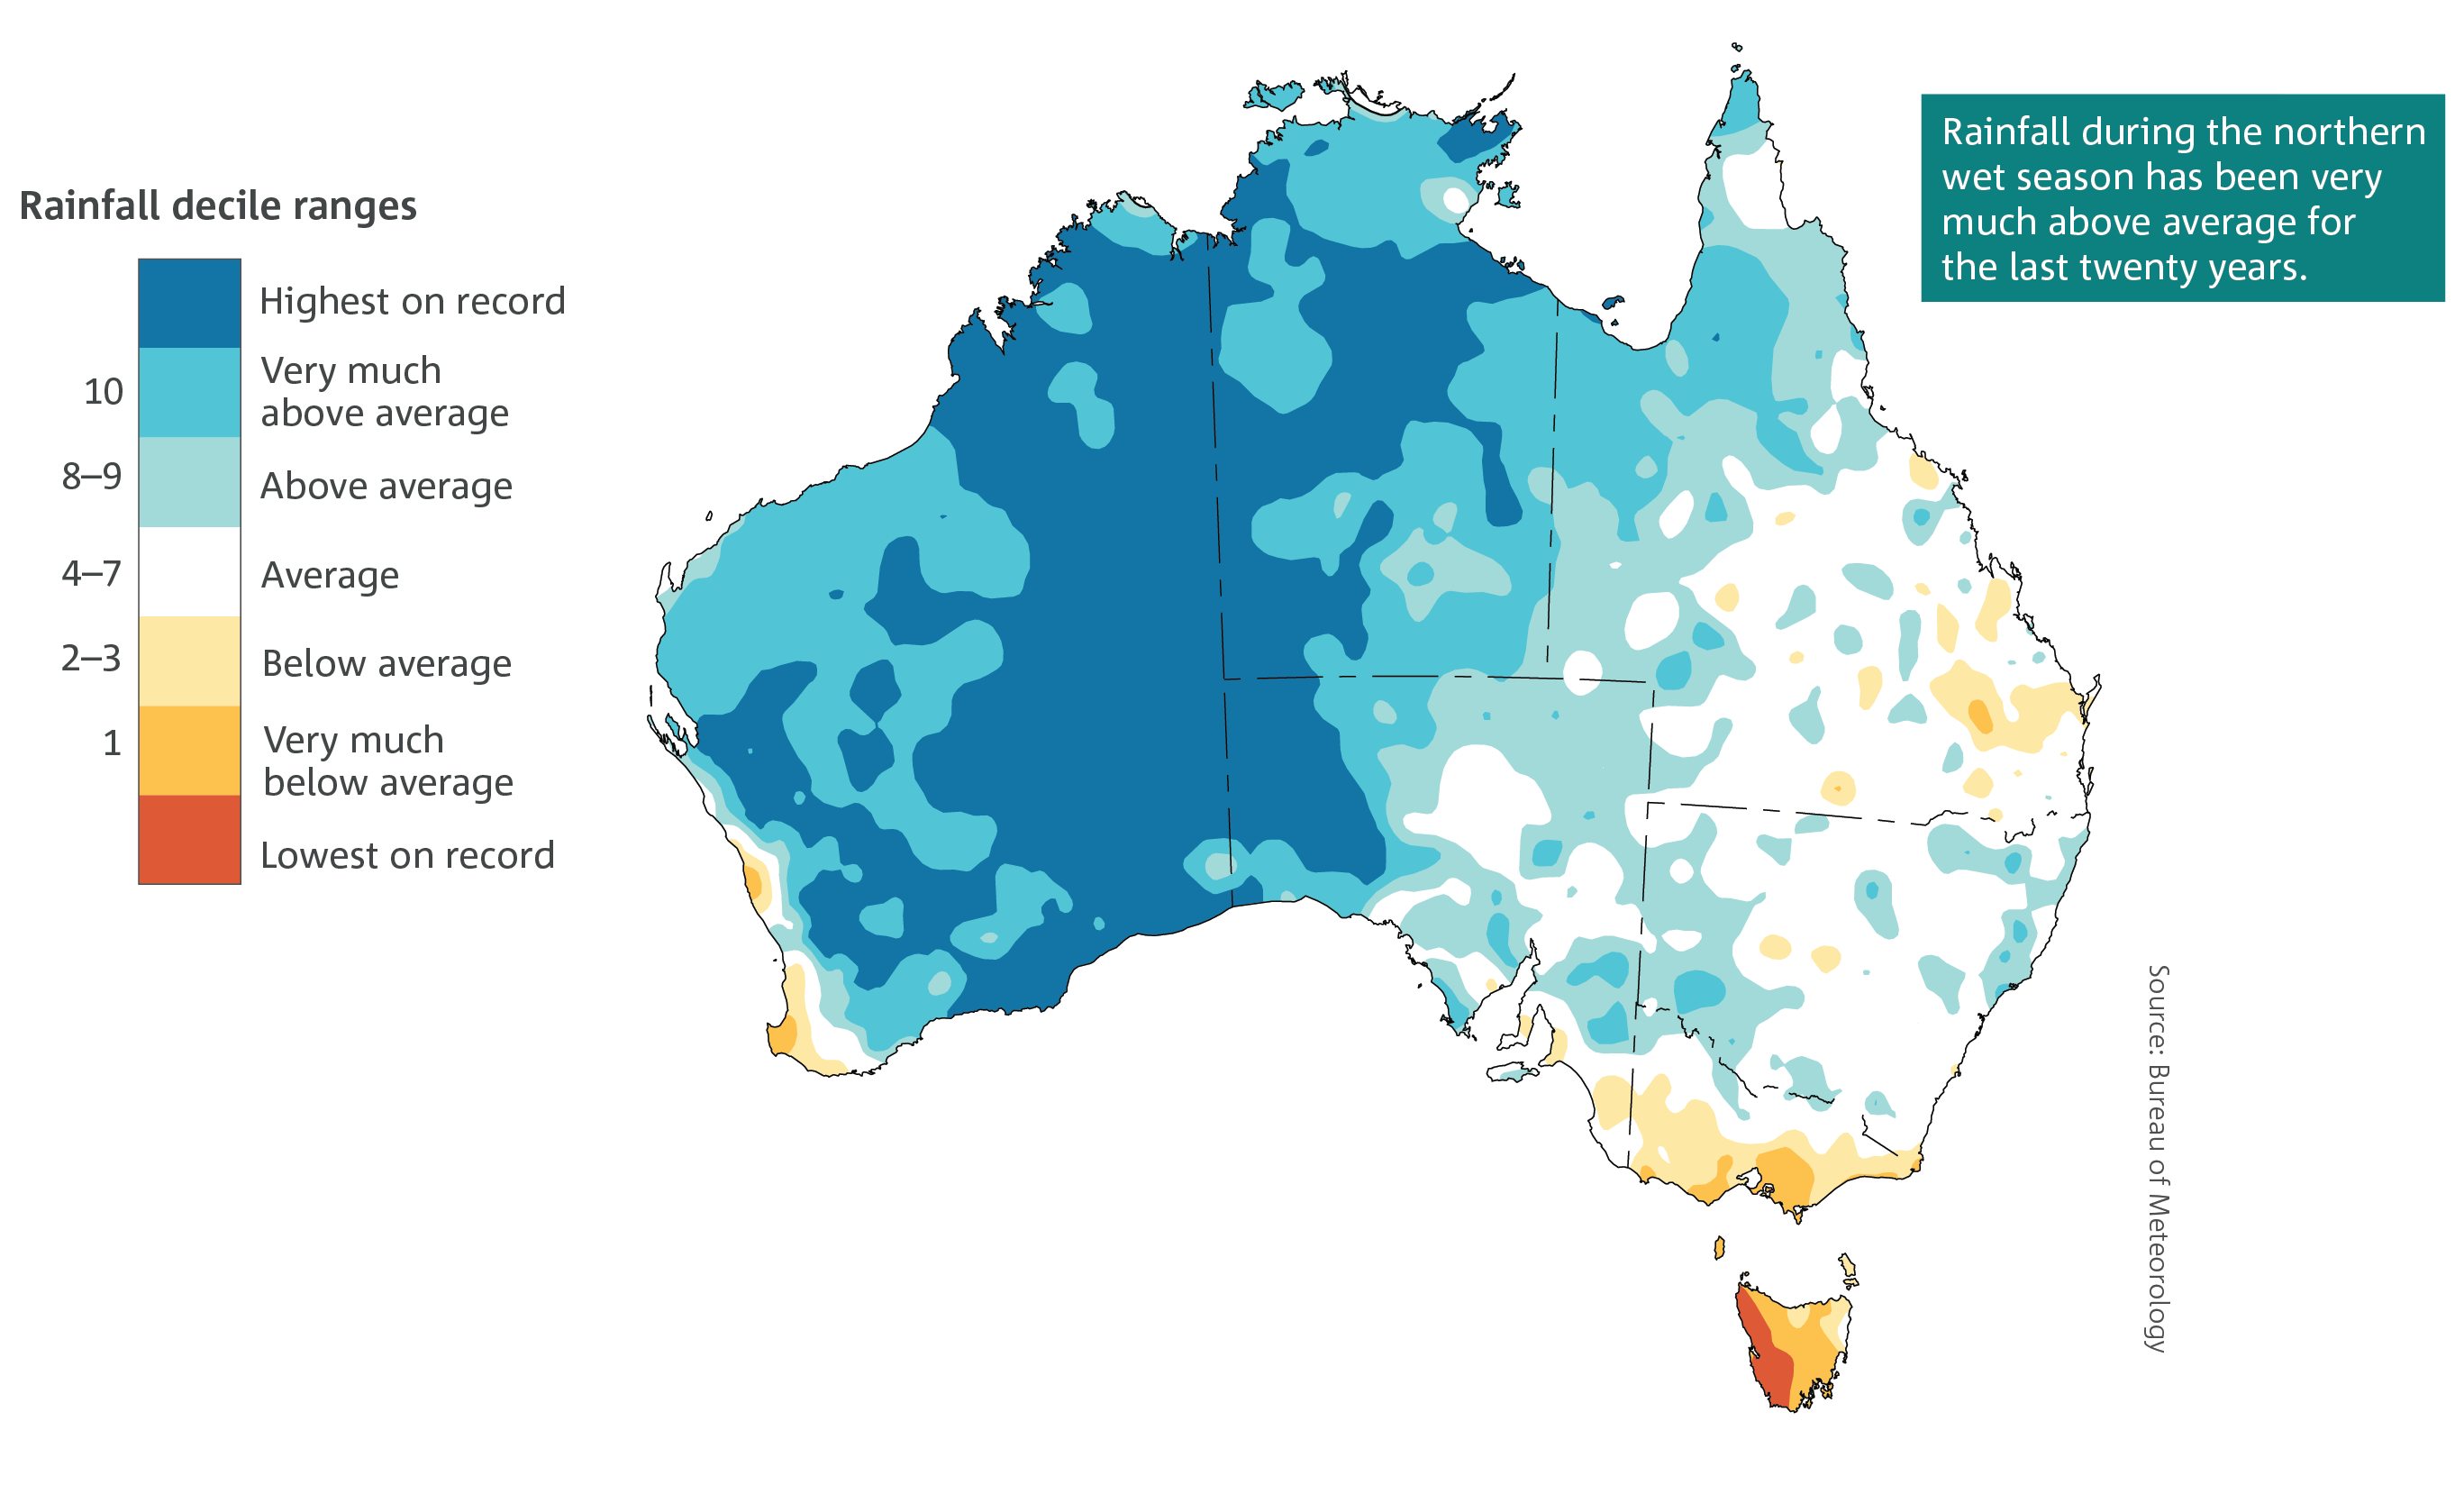
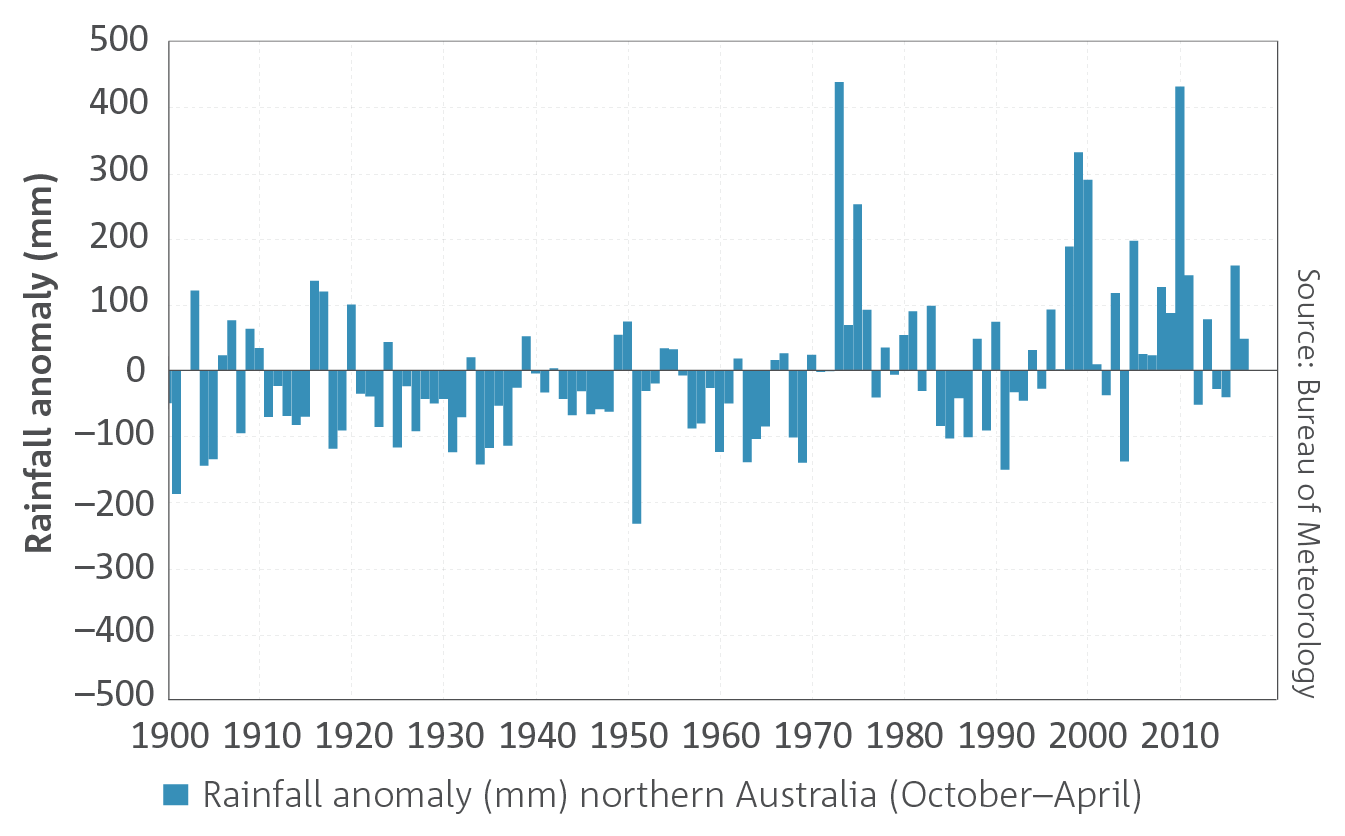
- Rainfall has increased across parts of northern Australia since the 1970s.
Australian rainfall is highly variable and is strongly influenced by phenomena such as El Niño, La Niña, and the Indian Ocean Dipole. Despite this large natural variability, underlying long-term trends are evident in some regions. There has been a shift towards drier conditions across southwestern and southeastern Australia during April to October. Northern Australia has been wetter across all seasons, but especially in the northwest during the tropical wet season.
Year-to-year variability occurs against the background drying trend across much of the southern half of Australia (south of 26° S). In 17 of the last 20 April to October periods since 1999, southern Australia has had below-average rainfall. Recent years with above-average rainfall in this region were generally associated with drivers of higher than usual rainfall across Australia, such as a strong negative Indian Ocean Dipole in 2016, and La Niña in 2010.
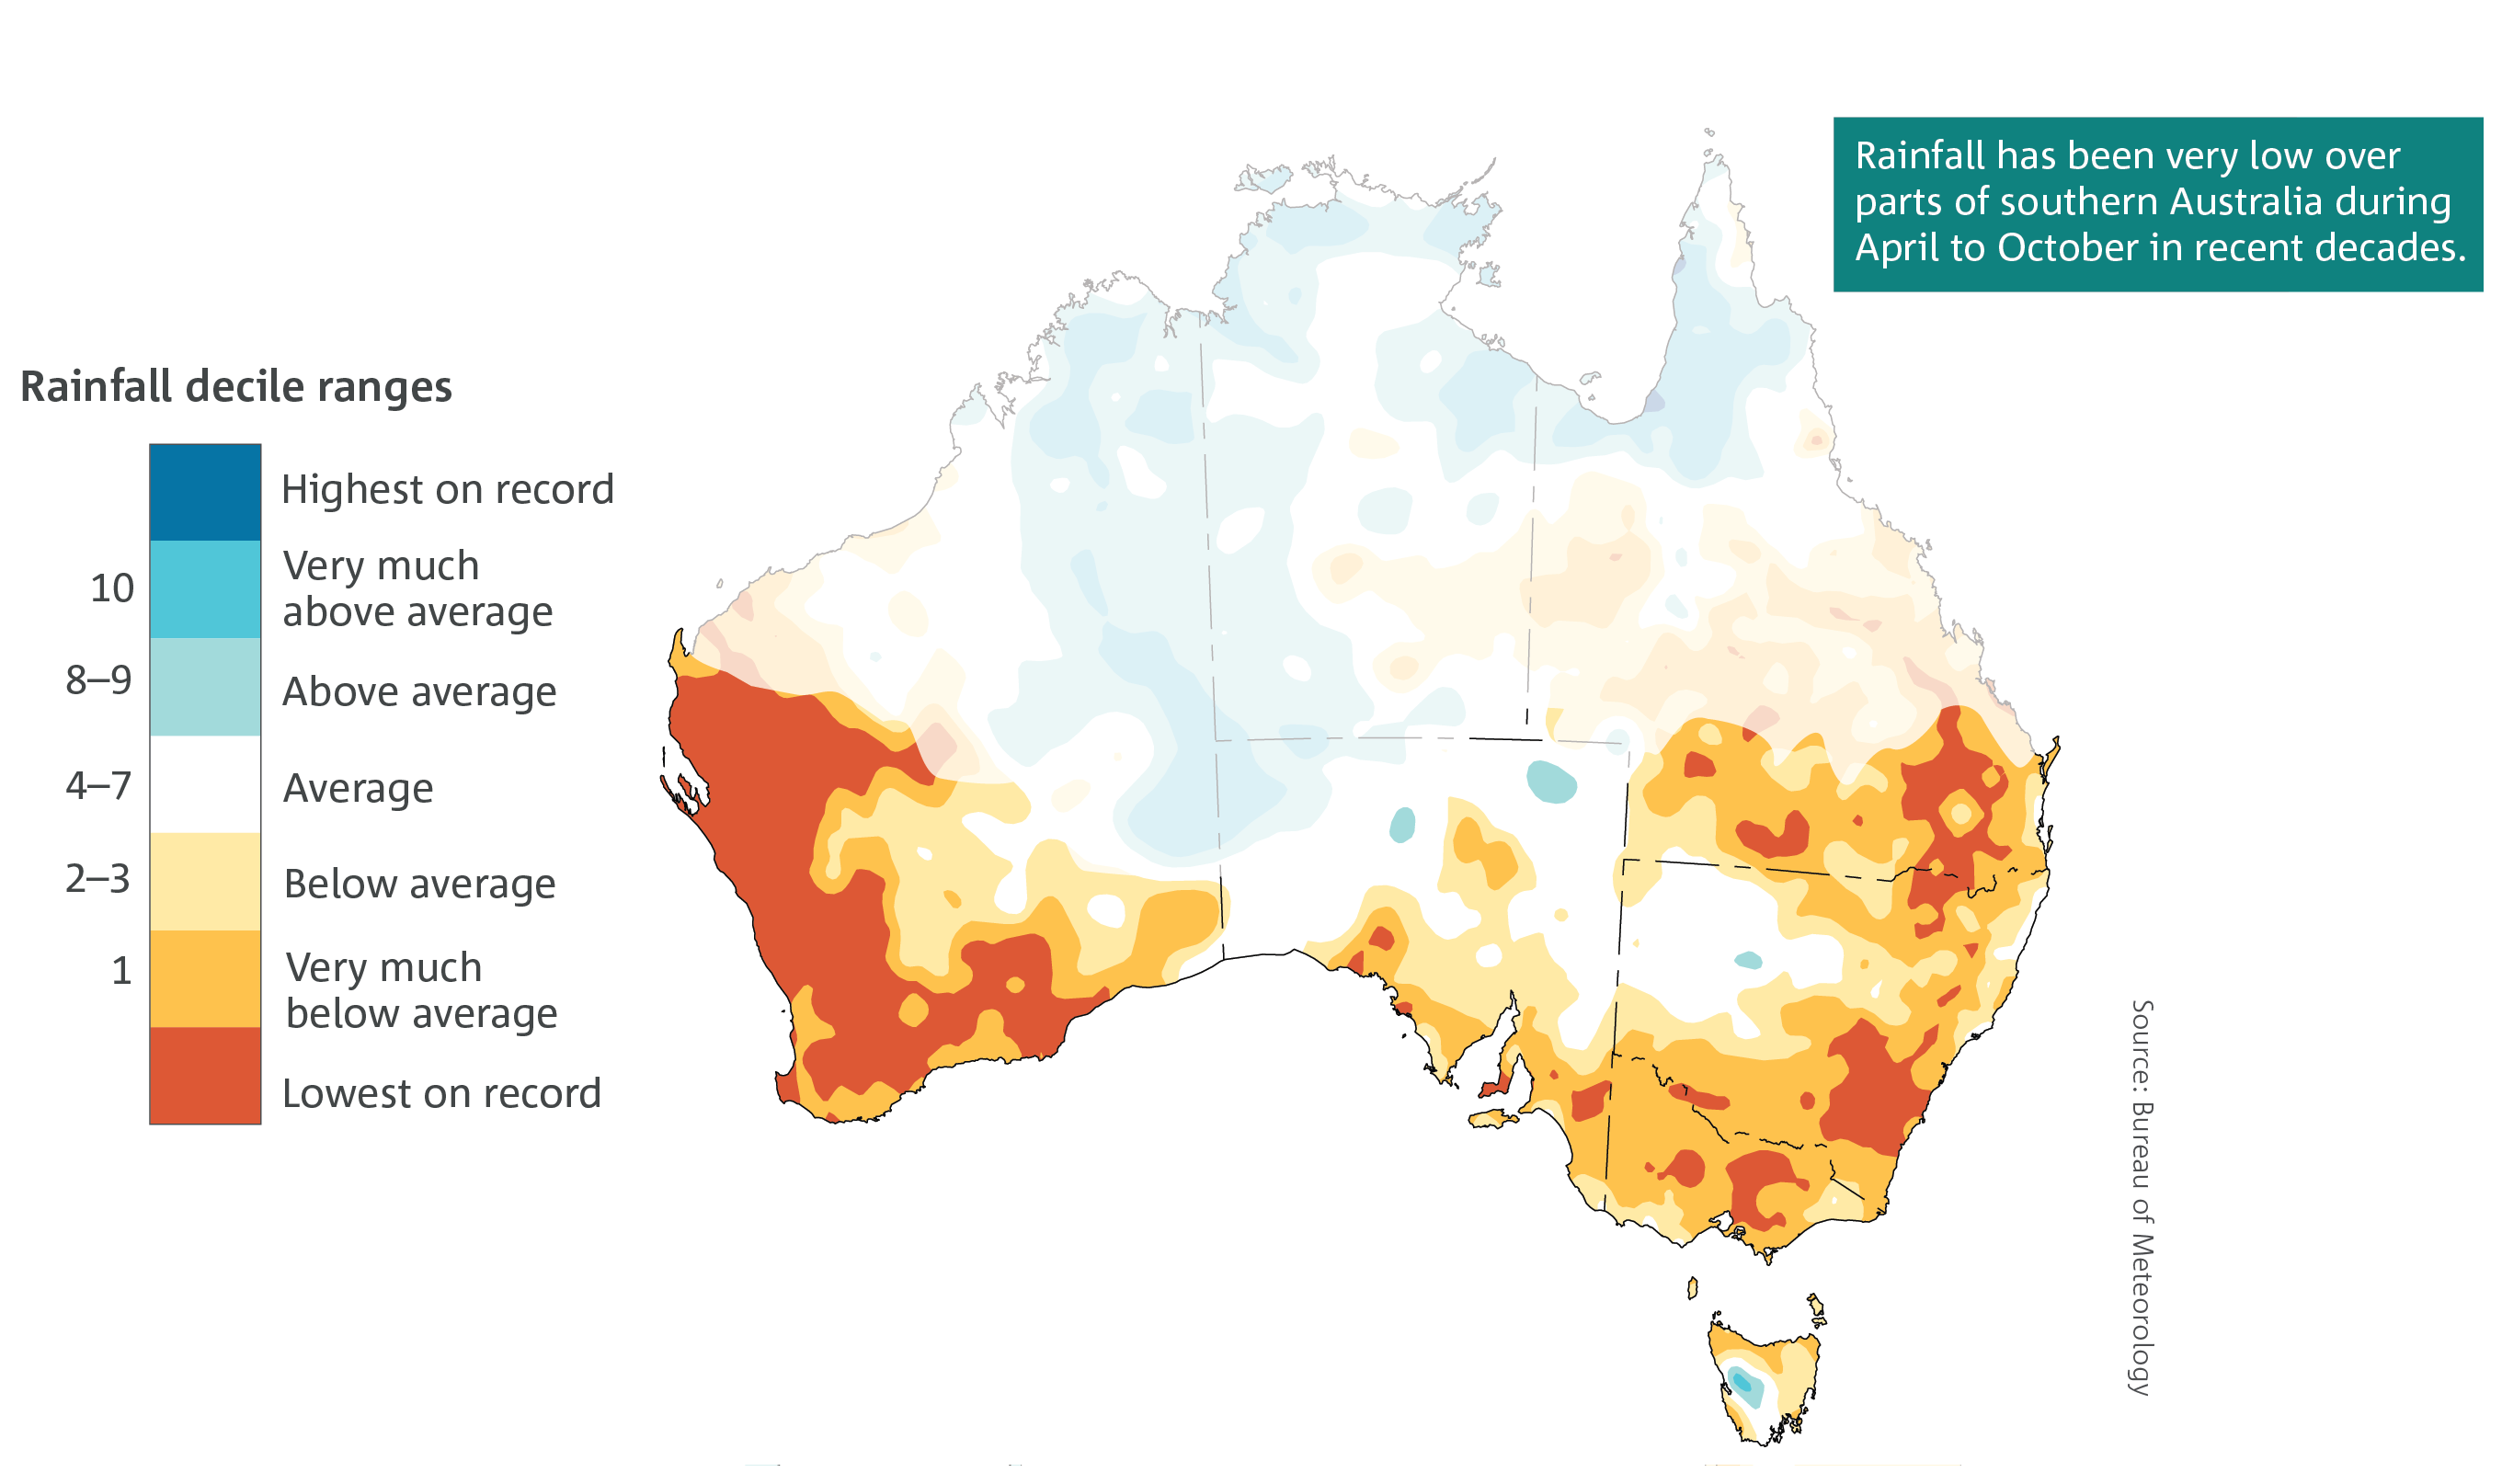
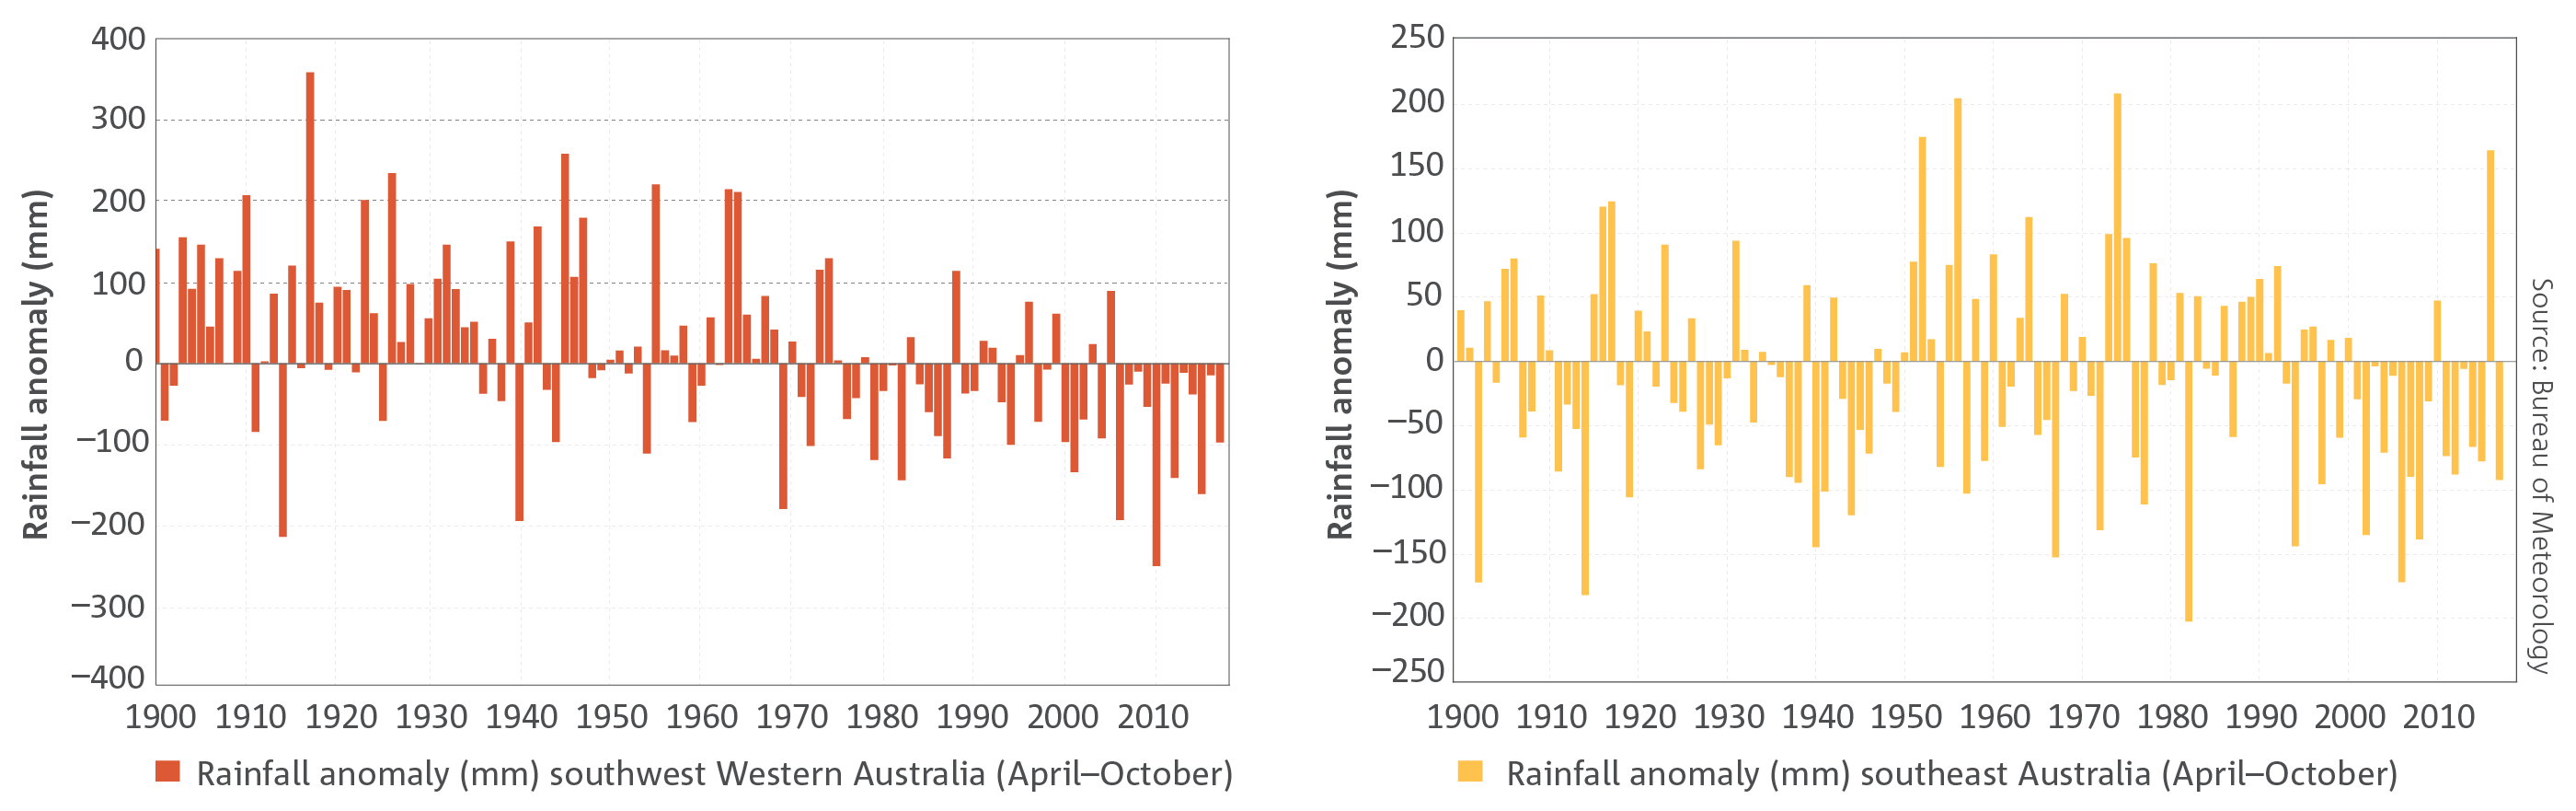
The drying in recent decades across southern Australia is the most sustained large-scale change in rainfall since national records began in 1900. The drying trend has been most evident in the southwestern and southeastern corners of the country. The drying trend is particularly strong between May to July over southwest Western Australia, with rainfall since 1970 around 20 per cent less than the average from 1900 to 1969. Since 1999, this reduction has increased to around 26 per cent. For the southeast of the continent, April to October rainfall for the period 1999 to 2018 has decreased by around 11 per cent when compared to the 1900 to 1998 period. This period encompasses the Millennium Drought, which saw low annual rainfall totals across the region from 1997 to 2010.
This decrease, at an agriculturally and hydrologically important time of the year, is linked with a trend towards higher mean sea level pressure in the region and a shift in large-scale weather patterns—more highs and fewer lows. This increase in mean sea level pressure across southern latitudes is a known response to global warming. There has been a reduction in the number of cold fronts impacting the southwest, and a decrease in the incidence and intensity of weather systems known as cut-off lows in the southeast regions of Australia. Cut-off lows bring the majority of rainfall and the most intense rainfalls in some regions of eastern Victoria and Tasmania.
Heavy rainfall
- There is evidence that some rainfall extremes are becoming more intense.
Although the range of natural variability in heavy rainfall is very large, there is evidence from observed weather station records that a higher proportion of total annual rainfall in recent decades has come from heavy rain days.
As the climate warms, heavy rainfall is expected to become more intense, based on the physical relationship between temperature and the water-holding capacity of the atmosphere. For heavy rain days, total rainfall is expected to increase by around 7 per cent per degree of warming. For short-duration, hourly, extreme rainfall events, observations in Australia generally show a larger than 7 per cent increase. Short-duration rain extremes are often associated with flash flooding.
Compound events
While scientists often report on changes in individual climate variables, such as rainfall, historically significant weather and climate events are often the result of the combined influence of extremes in multiple variables occurring simultaneously. These events are commonly the most impactful and hazardous, and planning for such events is a major component of disaster risk reduction and resilience.
Compound extreme events can occur in various ways. This includes an extreme storm surge, combined with extreme rainfall, leading to extreme coastal inundation. Similarly, extreme rainfall and extreme high wind events along the New South Wales coast are often associated with the simultaneous occurrence of an intense low pressure system, cold front and thunderstorms.
Compound extreme events can also describe the confluence of climate and weather extremes of varying timescales, such as a drought period intersecting with a prolonged heatwave, or record high daily temperatures—an occurrence which typically results in large impacts on agriculture, human health, fire weather and infrastructure.
Climate change can have a significant influence on the frequency, magnitude and impact of some types of compound events.
For example, the confluence of background warming trends, background drying trends and natural variability saw extreme heat and low rainfall across Tasmania during the spring, summer and autumn of 2015–2016. October 2015 saw the third highest mean monthly maximum temperature on record for the State, record low monthly rainfall and record high fire danger. These conditions rapidly transitioned to record atmospheric moisture and heavy rainfall in June. Tasmania experienced significant impacts from these events, including drought and fires, followed by flooding.
There is also a trend in some regions towards an increasing number of days when high fire danger ratings are combined with conditions that allow bushfires to generate thunderstorms. This can lead to extremely dangerous fire conditions as observed for the Canberra (2003) and Black Saturday (2009) fires, including generating additional fires from lightning strikes.
As climate change continues, the combination of increases in heavy rainfall and rising sea levels means that coastal and estuarine environments may have an increase in flood risk from multiple causes.
Projecting the occurrence and severity of future compound extreme events is a significant scientific challenge, as well as a very important one for future climate adaptation.
Streamflow
- Streamflow has decreased across southern Australia since the 1970s.
- Streamflow has increased in northern Australia, since the 1970s, in places where rainfall has increased.
The observed long-term reduction in rainfall across southern Australia has led to even greater reductions in streamflows. For example, the mean annual streamflow into Perth water storages has dropped from 338 GL during the period 1911–1974 to 134 GL during the subsequent years from 1975–2017. During this latter period there is a continuing decline to a mean annual inflow of 47 GL during the last six years.
Declines in streamflow have also been observed in four drainage divisions: the Murray–Darling Basin, South East Coast (Victoria) and South East Coast (New South Wales) (which include Sydney and Melbourne), and the South Australian Gulf (which includes Adelaide). In each of these drainage divisions between two thirds and three quarters of streamflow records show a declining trend since the 1970s.
In the Tanami–Timor Sea Coast drainage division in Northern Australia, which includes Darwin and covers much of the Northern Territory, there is an increasing trend in mean annual flows at more than half of the gauging stations, following an increase in rainfall since the 1970s.
Tropical cyclones
- There has been a decrease in the number of tropical cyclones observed in the Australian region since 1982.
Tropical cyclone activity in the Australian region, which is specified as the ocean and land areas from 90° E to 160° E in the southern hemisphere, has large variability from year-to-year, due to the influence of naturally occurring climate drivers. For example, the number of tropical cyclones in the Australian region generally declines with El Niño and increases with La Niña.
Observations since 1982 indicate a downward trend in the number of tropical cyclones in the Australian region.
In contrast to the number of tropical cyclones, cyclone intensity is harder to observe, so it is not currently possible to quantify any trends with a substantial degree of confidence.
Snow
- A downward trend in snow depth has been widely observed for Australian alpine regions since the late 1950s.
Downward trends in snow depth have been observed for Australian alpine regions since the late 1950s, with largest declines observed during spring. Downward trends in the spatial extent of snow cover in Australia have also been observed. Snow depth is closely related to maximum temperatures, and the observed declines are associated with the long-term trend of increasing temperatures.
Temperature
- Australia’s climate has warmed by just over 1 °C since 1910, leading to an increase in the frequency of extreme heat events.
Australia’s weather and climate continues to change in response to a warming global climate. Australia has warmed by just over 1 °C since 1910, with most warming since 1950. This warming has seen an increase in the frequency of extreme heat events and increased the severity of drought conditions during periods of below-average rainfall. Eight of Australia’s top ten warmest years on record have occurred since 2005.
The year-to-year changes in Australia’s climate are mostly associated with natural climate variability such as El Niño and La Niña in the tropical Pacific Ocean and phases of the Indian Ocean Dipole in the Indian Ocean. This natural variability now occurs on top of the warming trend, which can modify the impact of these natural drivers on the Australian climate.
Increases in temperature are observed across Australia in all seasons with both day and night-time temperatures showing warming. The shift to a warmer climate in Australia is accompanied by more extreme daily heat events. Record-warm monthly and seasonal temperatures have been observed in recent years, made more likely by climate change.
Examining the shift in the distributions of monthly day and night-time temperature shows that very high monthly maximum temperatures that occurred around 2 per cent of the time in the past (1951–1980) now occur around 12 per cent of the time (2003–2017). Very warm monthly minimum, or night-time, temperatures that occurred around 2 per cent of the time in the past (1951–1980) now also occur around 12 per cent of the time (2003–2017). This upward shift in the distributions of temperature has occurred across all seasons, with the largest change in spring.
Fire weather
- There has been a long-term increase in extreme fire weather and in the length of the fire season across large parts of Australia since the 1950s.
Fire weather is largely monitored in Australia using the Forest Fire Danger Index (FFDI). This index estimates the fire danger on a given day based on observations of temperature, rainfall, humidity and wind speed. The annual 90th percentile of daily FFDI (i.e., the most extreme 10 per cent of fire weather days) has increased in recent decades across many regions of Australia, especially in southern and eastern Australia. There has been an associated increase in the length of the fire weather season. Climate change, including increasing temperatures, is contributing to these changes. Considerable year-to-year variability also occurs, with La Niña years, for example 2010–2011 and 1999–2000, generally associated with a lower number of days with high FFDI values.
Rainfall
- April to October rainfall across southeastern and southwestern Australia has declined.
- Rainfall has increased across parts of northern Australia since the 1970s.
Australian rainfall is highly variable and is strongly influenced by phenomena such as El Niño, La Niña, and the Indian Ocean Dipole. Despite this large natural variability, underlying long-term trends are evident in some regions. There has been a shift towards drier conditions across southwestern and southeastern Australia during April to October. Northern Australia has been wetter across all seasons, but especially in the northwest during the tropical wet season.
Year-to-year variability occurs against the background drying trend across much of the southern half of Australia (south of 26° S). In 17 of the last 20 April to October periods since 1999, southern Australia has had below-average rainfall. Recent years with above-average rainfall in this region were generally associated with drivers of higher than usual rainfall across Australia, such as a strong negative Indian Ocean Dipole in 2016, and La Niña in 2010.
The drying in recent decades across southern Australia is the most sustained large-scale change in rainfall since national records began in 1900. The drying trend has been most evident in the southwestern and southeastern corners of the country. The drying trend is particularly strong between May to July over southwest Western Australia, with rainfall since 1970 around 20 per cent less than the average from 1900 to 1969. Since 1999, this reduction has increased to around 26 per cent. For the southeast of the continent, April to October rainfall for the period 1999 to 2018 has decreased by around 11 per cent when compared to the 1900 to 1998 period. This period encompasses the Millennium Drought, which saw low annual rainfall totals across the region from 1997 to 2010.
This decrease, at an agriculturally and hydrologically important time of the year, is linked with a trend towards higher mean sea level pressure in the region and a shift in large-scale weather patterns—more highs and fewer lows. This increase in mean sea level pressure across southern latitudes is a known response to global warming. There has been a reduction in the number of cold fronts impacting the southwest, and a decrease in the incidence and intensity of weather systems known as cut-off lows in the southeast regions of Australia. Cut-off lows bring the majority of rainfall and the most intense rainfalls in some regions of eastern Victoria and Tasmania.
Heavy rainfall
- There is evidence that some rainfall extremes are becoming more intense.
Although the range of natural variability in heavy rainfall is very large, there is evidence from observed weather station records that a higher proportion of total annual rainfall in recent decades has come from heavy rain days.
As the climate warms, heavy rainfall is expected to become more intense, based on the physical relationship between temperature and the water-holding capacity of the atmosphere. For heavy rain days, total rainfall is expected to increase by around 7 per cent per degree of warming. For short-duration, hourly, extreme rainfall events, observations in Australia generally show a larger than 7 per cent increase. Short-duration rain extremes are often associated with flash flooding.
Compound events
While scientists often report on changes in individual climate variables, such as rainfall, historically significant weather and climate events are often the result of the combined influence of extremes in multiple variables occurring simultaneously. These events are commonly the most impactful and hazardous, and planning for such events is a major component of disaster risk reduction and resilience.
Compound extreme events can occur in various ways. This includes an extreme storm surge, combined with extreme rainfall, leading to extreme coastal inundation. Similarly, extreme rainfall and extreme high wind events along the New South Wales coast are often associated with the simultaneous occurrence of an intense low pressure system, cold front and thunderstorms.
Compound extreme events can also describe the confluence of climate and weather extremes of varying timescales, such as a drought period intersecting with a prolonged heatwave, or record high daily temperatures—an occurrence which typically results in large impacts on agriculture, human health, fire weather and infrastructure.
Climate change can have a significant influence on the frequency, magnitude and impact of some types of compound events.
For example, the confluence of background warming trends, background drying trends and natural variability saw extreme heat and low rainfall across Tasmania during the spring, summer and autumn of 2015–2016. October 2015 saw the third highest mean monthly maximum temperature on record for the State, record low monthly rainfall and record high fire danger. These conditions rapidly transitioned to record atmospheric moisture and heavy rainfall in June. Tasmania experienced significant impacts from these events, including drought and fires, followed by flooding.
There is also a trend in some regions towards an increasing number of days when high fire danger ratings are combined with conditions that allow bushfires to generate thunderstorms. This can lead to extremely dangerous fire conditions as observed for the Canberra (2003) and Black Saturday (2009) fires, including generating additional fires from lightning strikes.
As climate change continues, the combination of increases in heavy rainfall and rising sea levels means that coastal and estuarine environments may have an increase in flood risk from multiple causes.
Projecting the occurrence and severity of future compound extreme events is a significant scientific challenge, as well as a very important one for future climate adaptation.
Streamflow
- Streamflow has decreased across southern Australia since the 1970s.
- Streamflow has increased in northern Australia, since the 1970s, in places where rainfall has increased.
The observed long-term reduction in rainfall across southern Australia has led to even greater reductions in streamflows. For example, the mean annual streamflow into Perth water storages has dropped from 338 GL during the period 1911–1974 to 134 GL during the subsequent years from 1975–2017. During this latter period there is a continuing decline to a mean annual inflow of 47 GL during the last six years.
Declines in streamflow have also been observed in four drainage divisions: the Murray–Darling Basin, South East Coast (Victoria) and South East Coast (New South Wales) (which include Sydney and Melbourne), and the South Australian Gulf (which includes Adelaide). In each of these drainage divisions between two thirds and three quarters of streamflow records show a declining trend since the 1970s.
In the Tanami–Timor Sea Coast drainage division in Northern Australia, which includes Darwin and covers much of the Northern Territory, there is an increasing trend in mean annual flows at more than half of the gauging stations, following an increase in rainfall since the 1970s.
Tropical cyclones
- There has been a decrease in the number of tropical cyclones observed in the Australian region since 1982.
Tropical cyclone activity in the Australian region, which is specified as the ocean and land areas from 90° E to 160° E in the southern hemisphere, has large variability from year-to-year, due to the influence of naturally occurring climate drivers. For example, the number of tropical cyclones in the Australian region generally declines with El Niño and increases with La Niña.
Observations since 1982 indicate a downward trend in the number of tropical cyclones in the Australian region.
In contrast to the number of tropical cyclones, cyclone intensity is harder to observe, so it is not currently possible to quantify any trends with a substantial degree of confidence.
Snow
- A downward trend in snow depth has been widely observed for Australian alpine regions since the late 1950s.
Downward trends in snow depth have been observed for Australian alpine regions since the late 1950s, with largest declines observed during spring. Downward trends in the spatial extent of snow cover in Australia have also been observed. Snow depth is closely related to maximum temperatures, and the observed declines are associated with the long-term trend of increasing temperatures.