Sea surface temperature
The ocean surface around Australia has warmed, contributing to longer and more frequent marine heatwaves
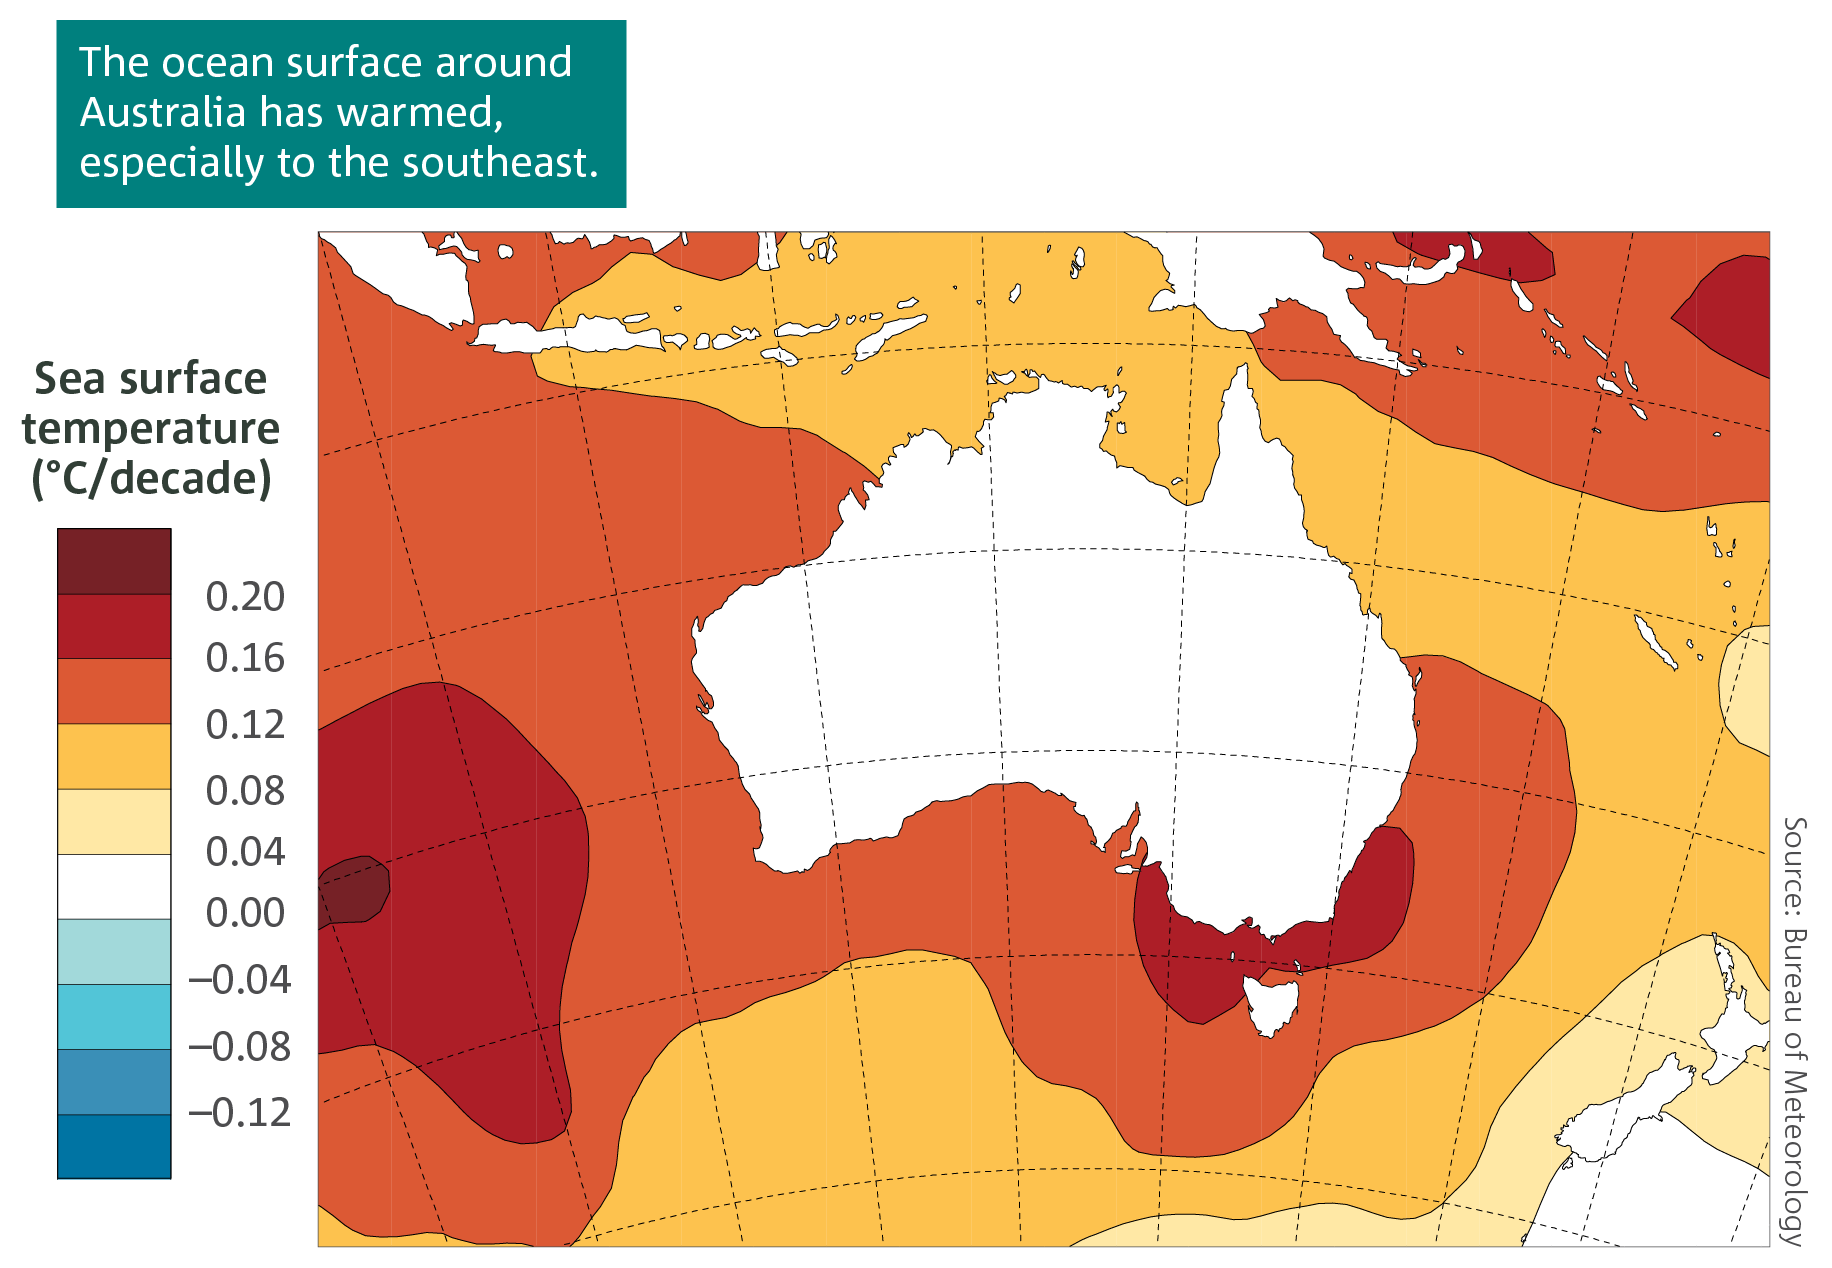 The ocean surface around Australia has warmed over recent decades at a similar rate to the air temperature. Sea surface temperature in the Australian region has warmed by around 1 °C since 1910, with eight of the ten warmest years on record occurring since 2010.
Part of the East Australian Current now extends further south, creating an area of more rapid warming in the Tasman Sea. This extension is having numerous impacts on marine ecosystems, including many marine species extending their habitat range further south.
Warming of the ocean has contributed to longer and more frequent periods when the sea surface temperature is in the upper range of historical baseline conditions for five days or more, known as marine heatwaves. There were long and intense marine heatwaves in the Tasman Sea and around southeast Australia and Tasmania from September 2015 to May 2016 and from November 2017 to March 2018. Scientific analysis shows that the severity of both events can be attributed to anthropogenic climate change. Recent marine heatwaves are linked to coral bleaching in the Great Barrier Reef (see box on page 12).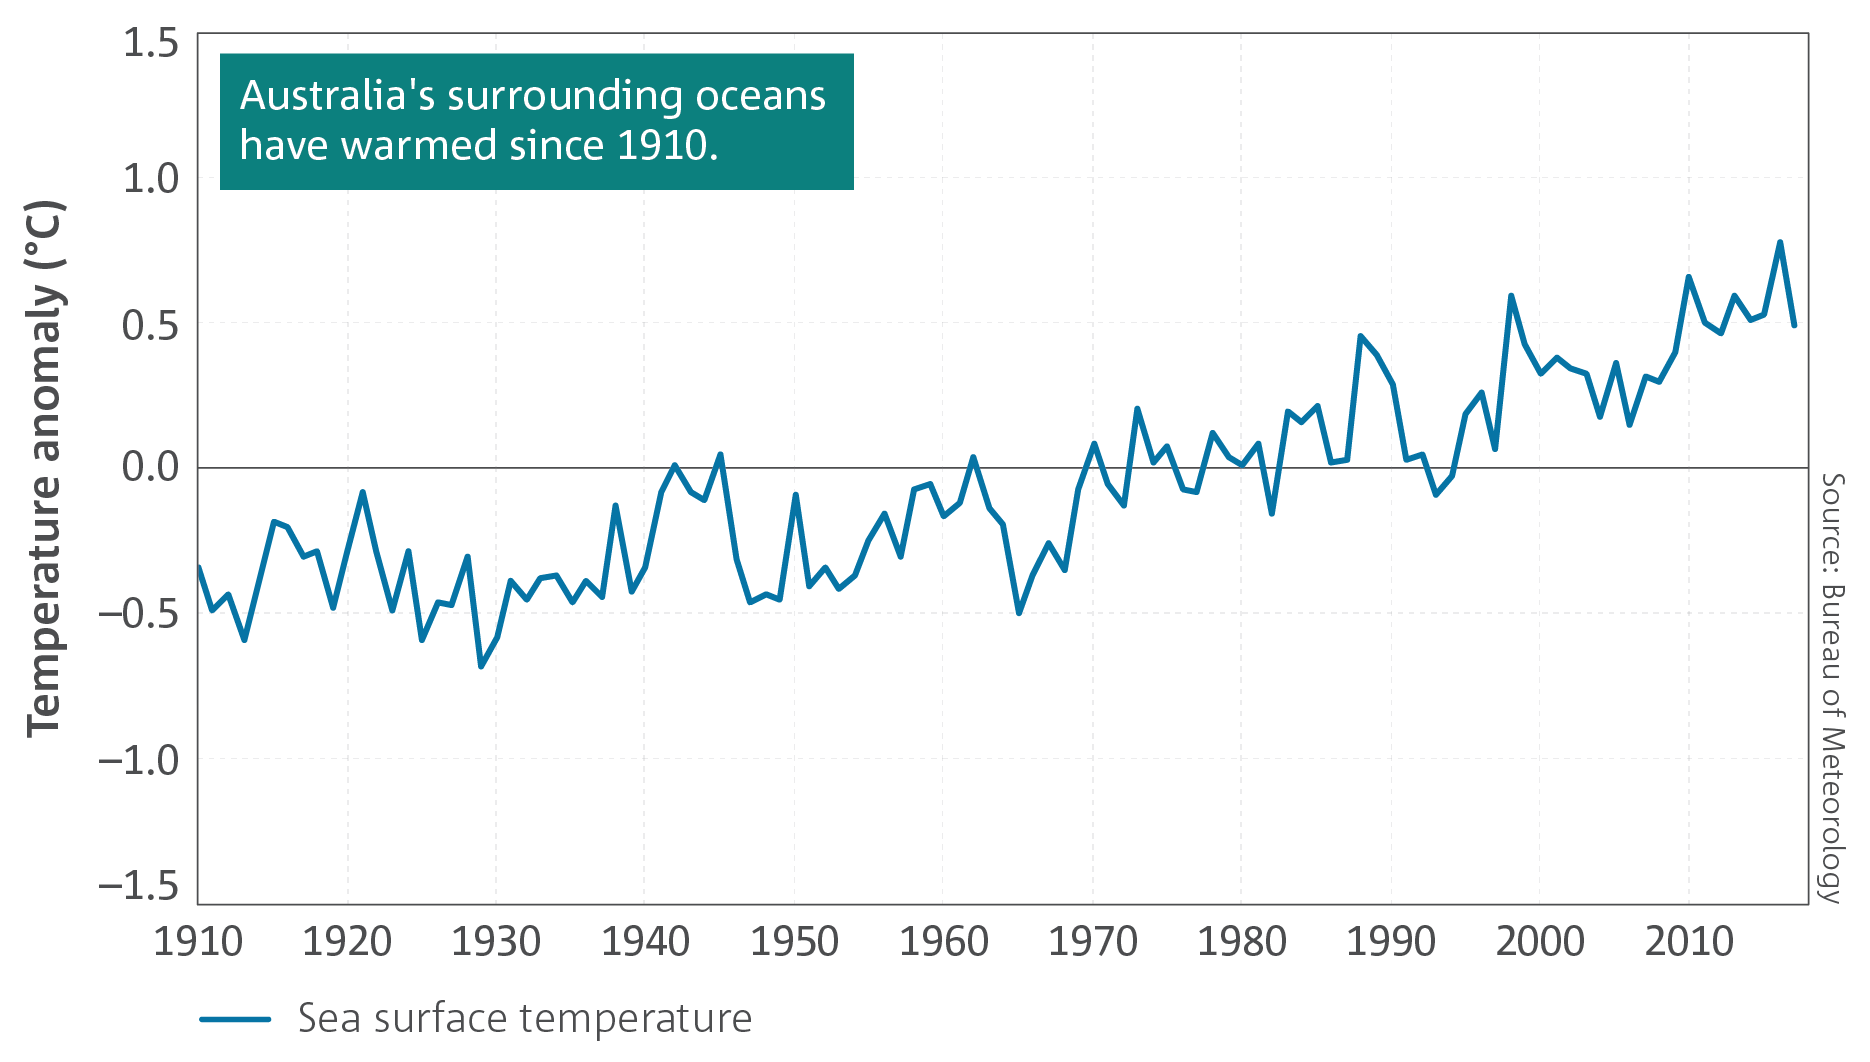
Ocean heat content
The world’s oceans are taking up more than 90 per cent of the extra energy stored by the planet as a result of enhanced greenhouse gas concentrations, and the southern hemisphere oceans have taken up the majority of this heat.
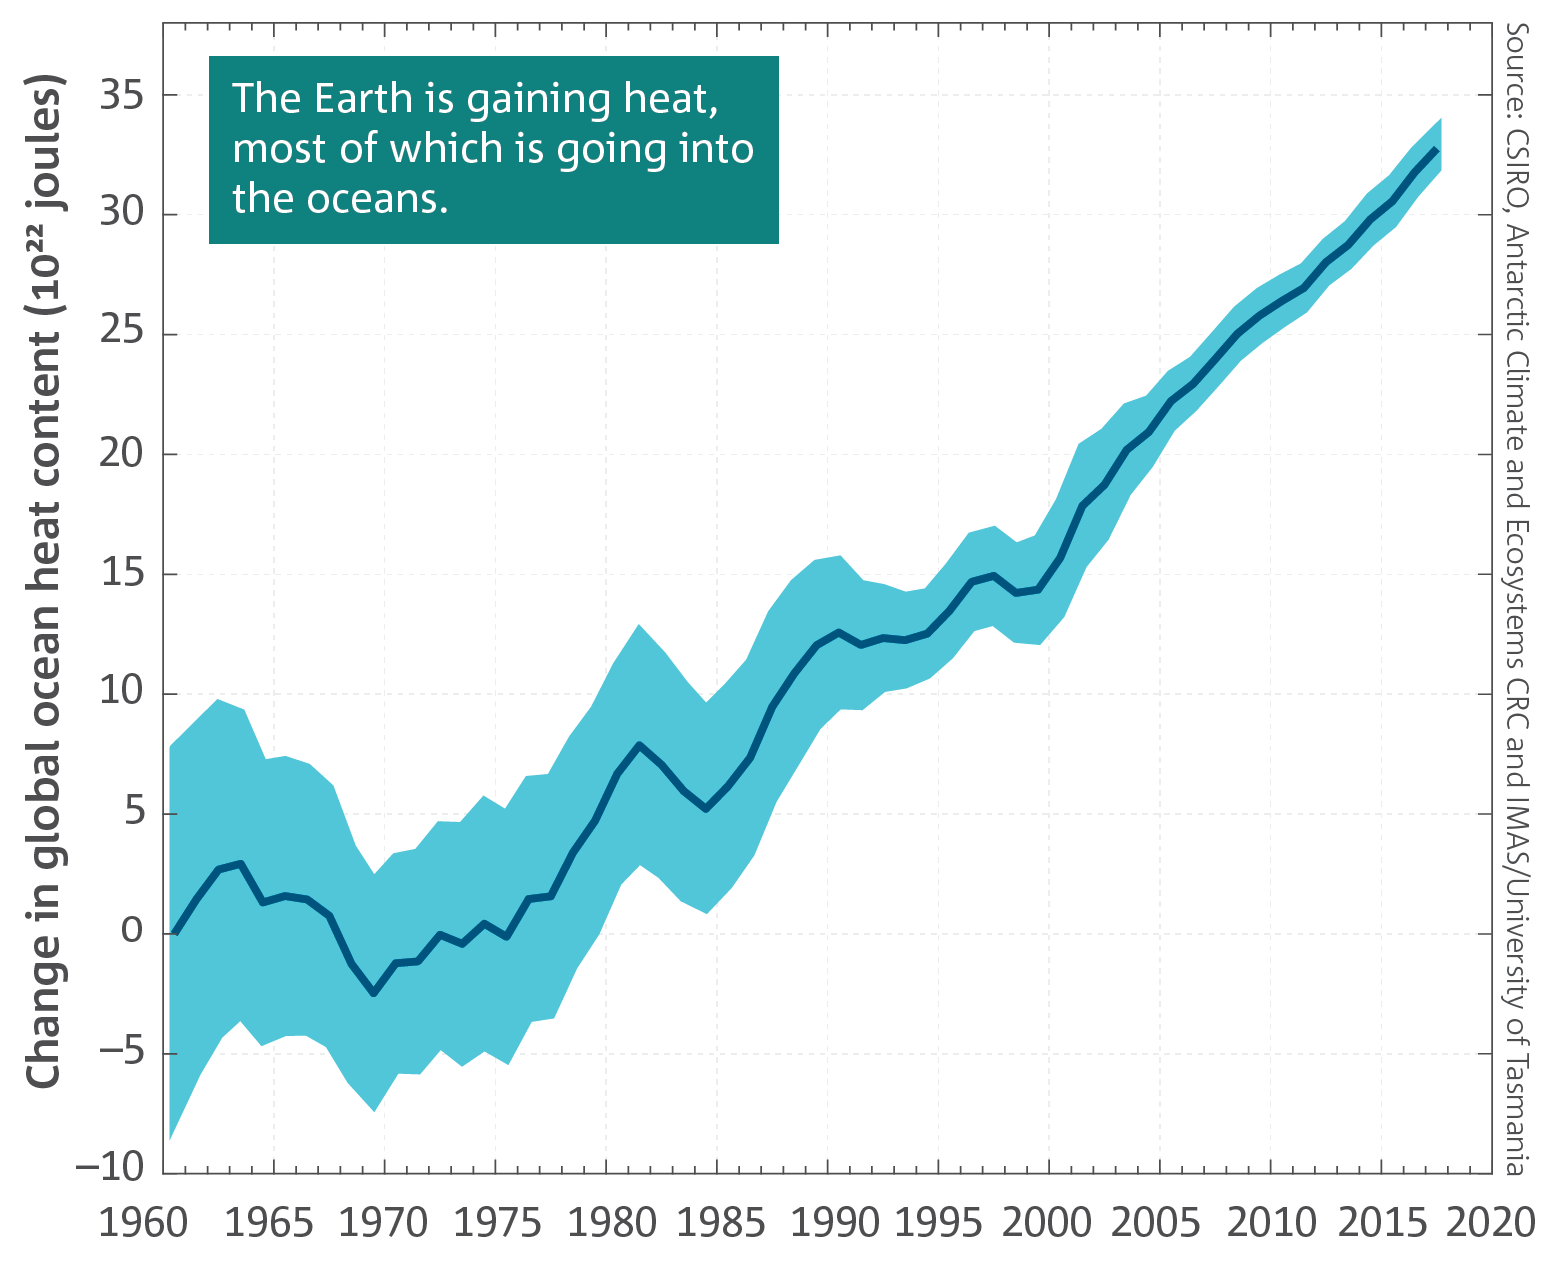 The world’s oceans play a critical role in the climate system. More than 90 per cent of the additional energy arising from the enhanced greenhouse effect is taken up by the ocean, slowing down the rate of warming at the Earth’s surface. Heat is absorbed at the surface and then moves to the deep ocean in those regions where currents move water vertic
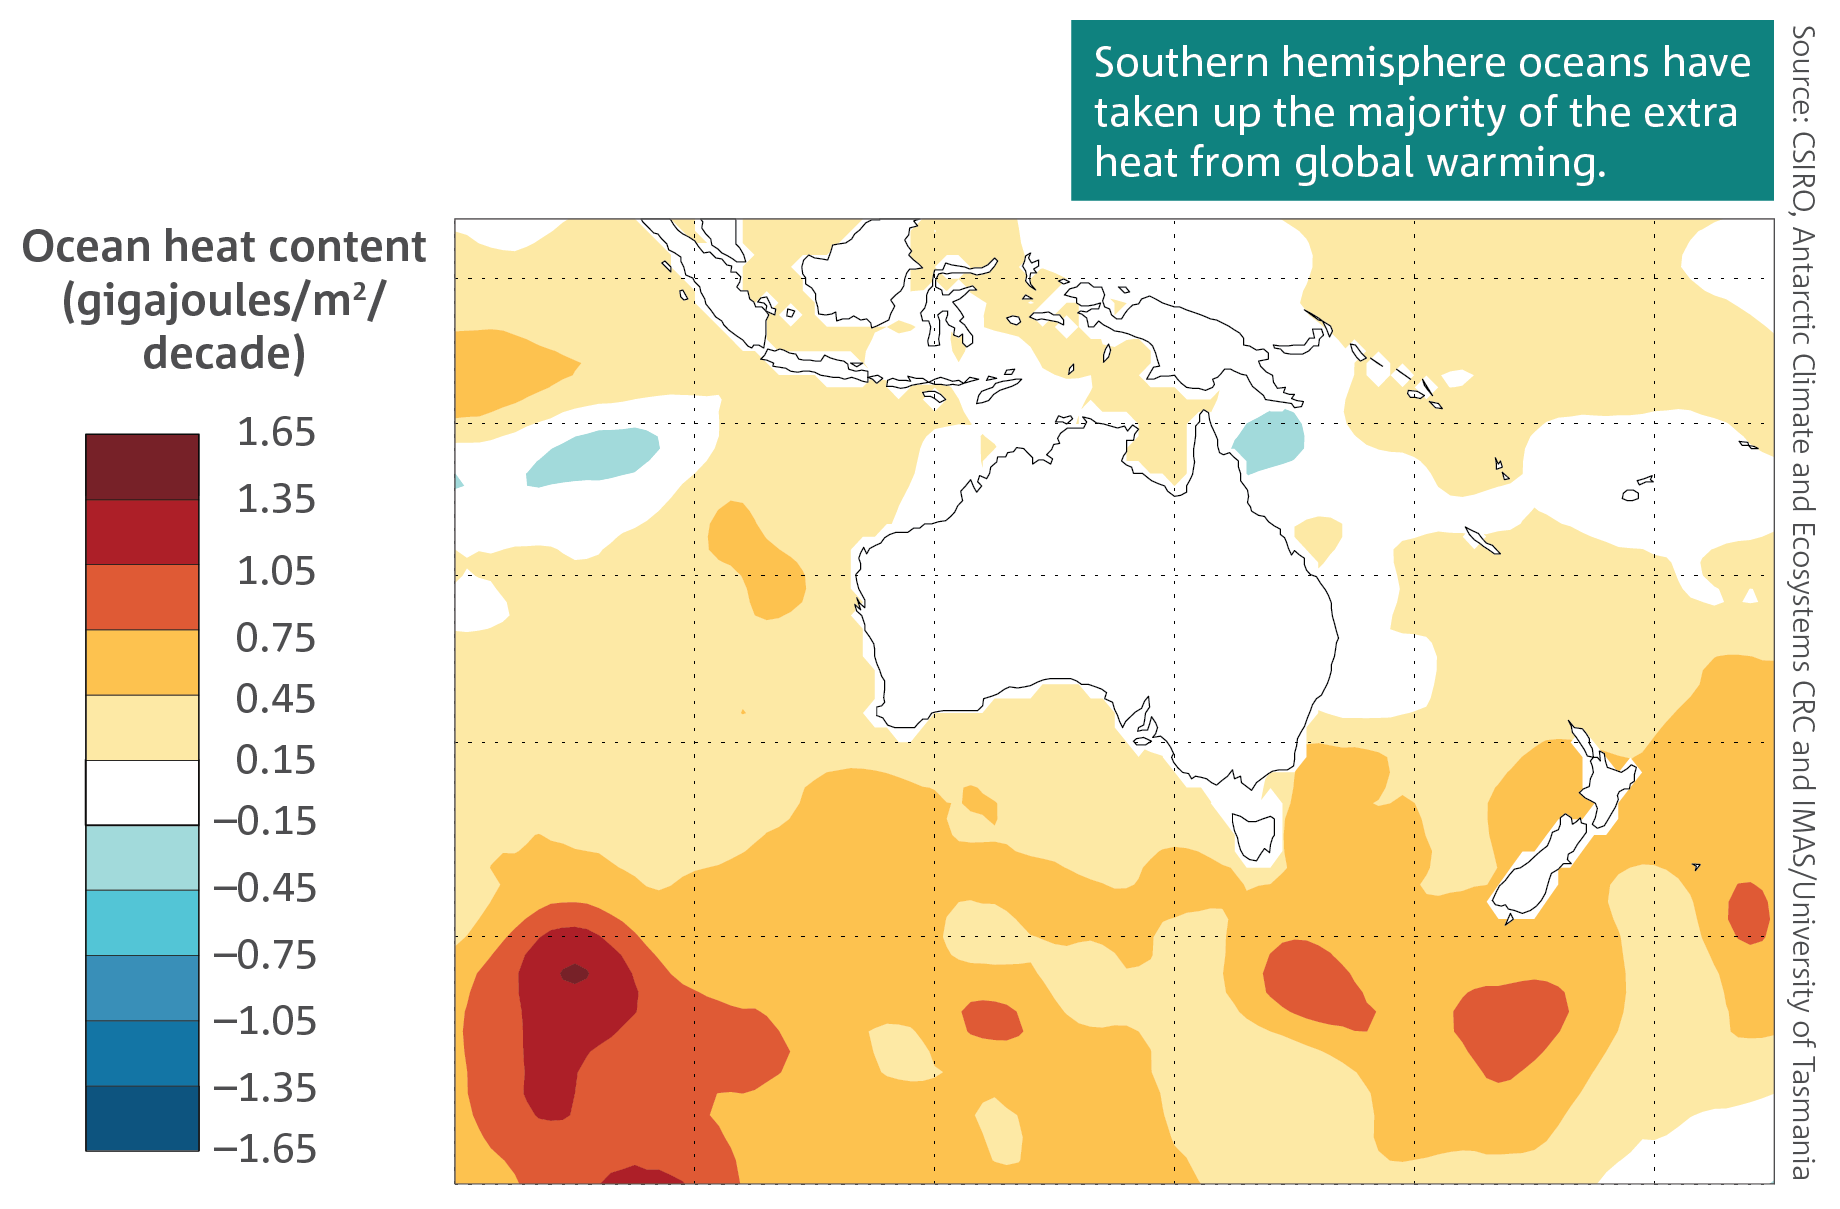 ally. As a result, the ocean is warming both near the surface and at depth, with the rate varying between regions and depths.
The upper ocean is more extensively measured than the deep ocean. Between 1960 and 2017 the global ocean between the surface and a depth of 700 m gained 24 x 1022 joules of additional heat. This is more than 60 per cent of the heat accumulated over the full depth of the ocean. Due to the location of currents that move water vertically, the southern hemisphere oceans have taken up the majority of the heat, including the Southern Ocean to the south of Australia.
The rate at which the deep ocean below 700 m is warming is slow but steady, compared to the more variable rate of change in the upper ocean. Long-term trends in the deep ocean show a clear warming, however there are far fewer observations below 2000 m than near the surface, so the magnitude of this warming is less certain. The observation coverage in the deep ocean will dramatically increase in coming years as the newest generation of observing technology becomes operational, including the automated samplers known as ARGO floats with an extended depth range down to 6000 m.
Ocean heat and coral reefs
Warming ocean temperatures and an increase in the frequency and intensity of marine heatwaves pose a major threat to the long-term health and resilience of coral reef ecosystems. Globally, large-scale mass coral bleaching events have occurred with increasing frequency and extent since the latter decades of the 20th Century. Bleaching is a stress response of corals, as the water warms the symbiotic relationship between the coral and its zooxanthellae breaks down, turning corals pale. Without these zooxanthellae, most corals struggle to survive, and can ultimately die if the thermal stress is too severe or prolonged.
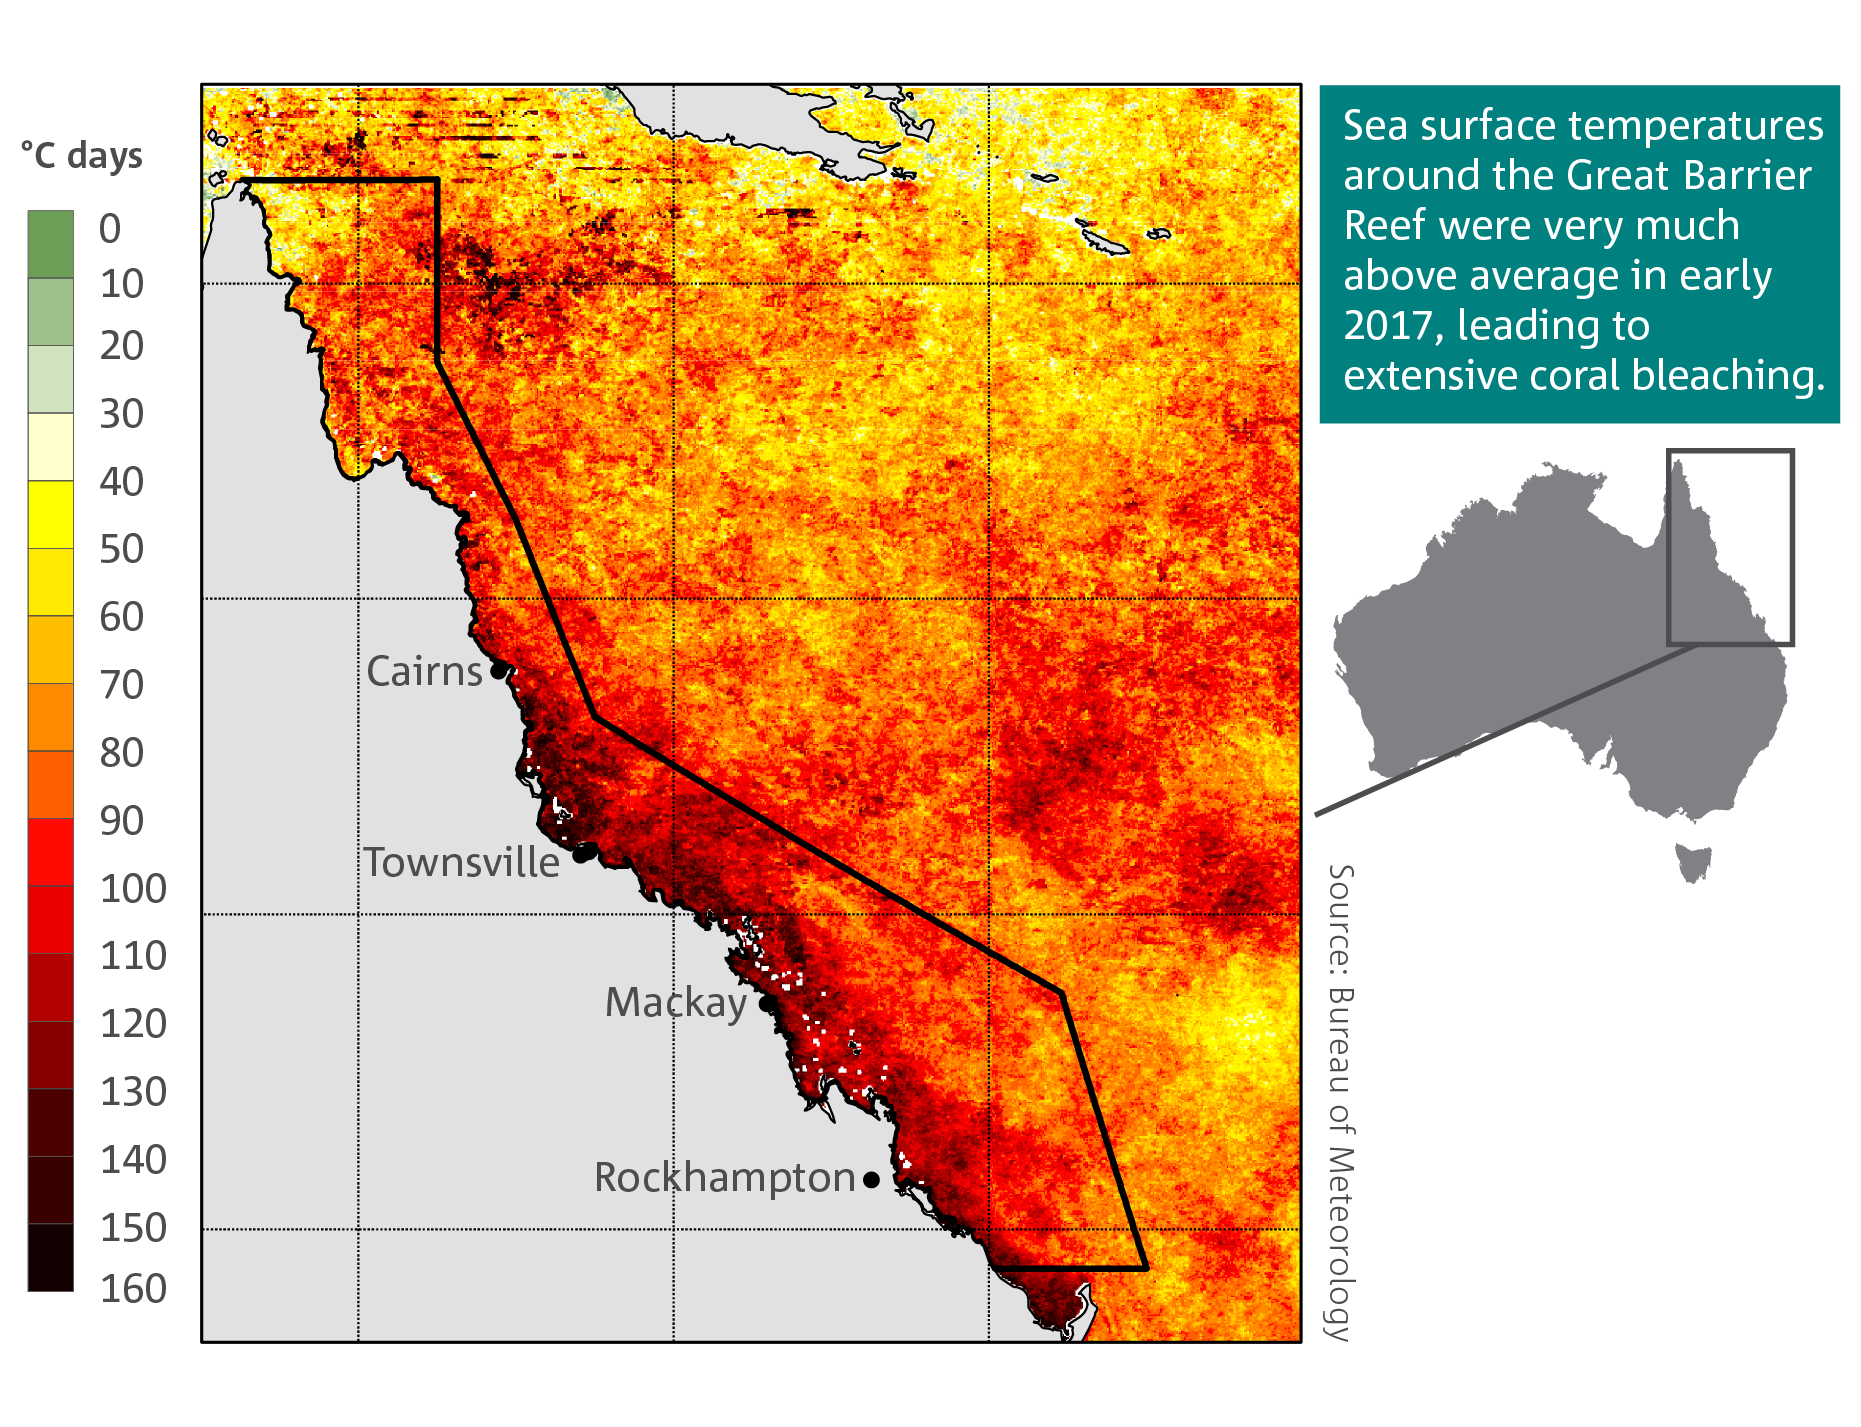 Bleaching on the Great Barrier Reef has occurred in the past, but with increased frequency and extent in recent decades. Widespread bleaching was observed in 1998, driven by higher summer temperatures associated with a strong El Niño combined with long-term warming trends. The last two years (2016 and 2017) have seen mass bleaching over parts of the Reef in consecutive years for the first time, with the northern Great Barrier Reef experiencing bleaching in both summers.
In February to May 2016, the bleaching was associated with some of the warmest sea surface temperatures ever recorded, with temperatures well above the long-term monthly averages in February, March and April. As a result, 30 per cent of all coral cover across the entire Great Barrier Reef was lost, and 50 per cent in the northern third was lost between March and November 2016. This was four times greater than previous mass-bleaching events in 2002 and 1998.
A second mass bleaching occurred in 2017 linked to another marine heatwave, with temperatures again well above the long-term mean.
Both events could have been more extensive in the Southern Great Barrier Reef if it were not for cooling winds associated with distant tropical cyclones Winston and Tatiana in 2016 and tropical cyclone Debbie in 2017.
The primary cause of both marine heatwaves and mass bleaching events was very likely due to warming oceans as a result of anthropogenic climate change, compounded in early 2016 by a very strong El Niño event.
Sea level
- Global sea level has risen by over 20 cm since 1880, and the rate has been accelerating in recent decades.
- Rates of sea level rise vary around Australia.
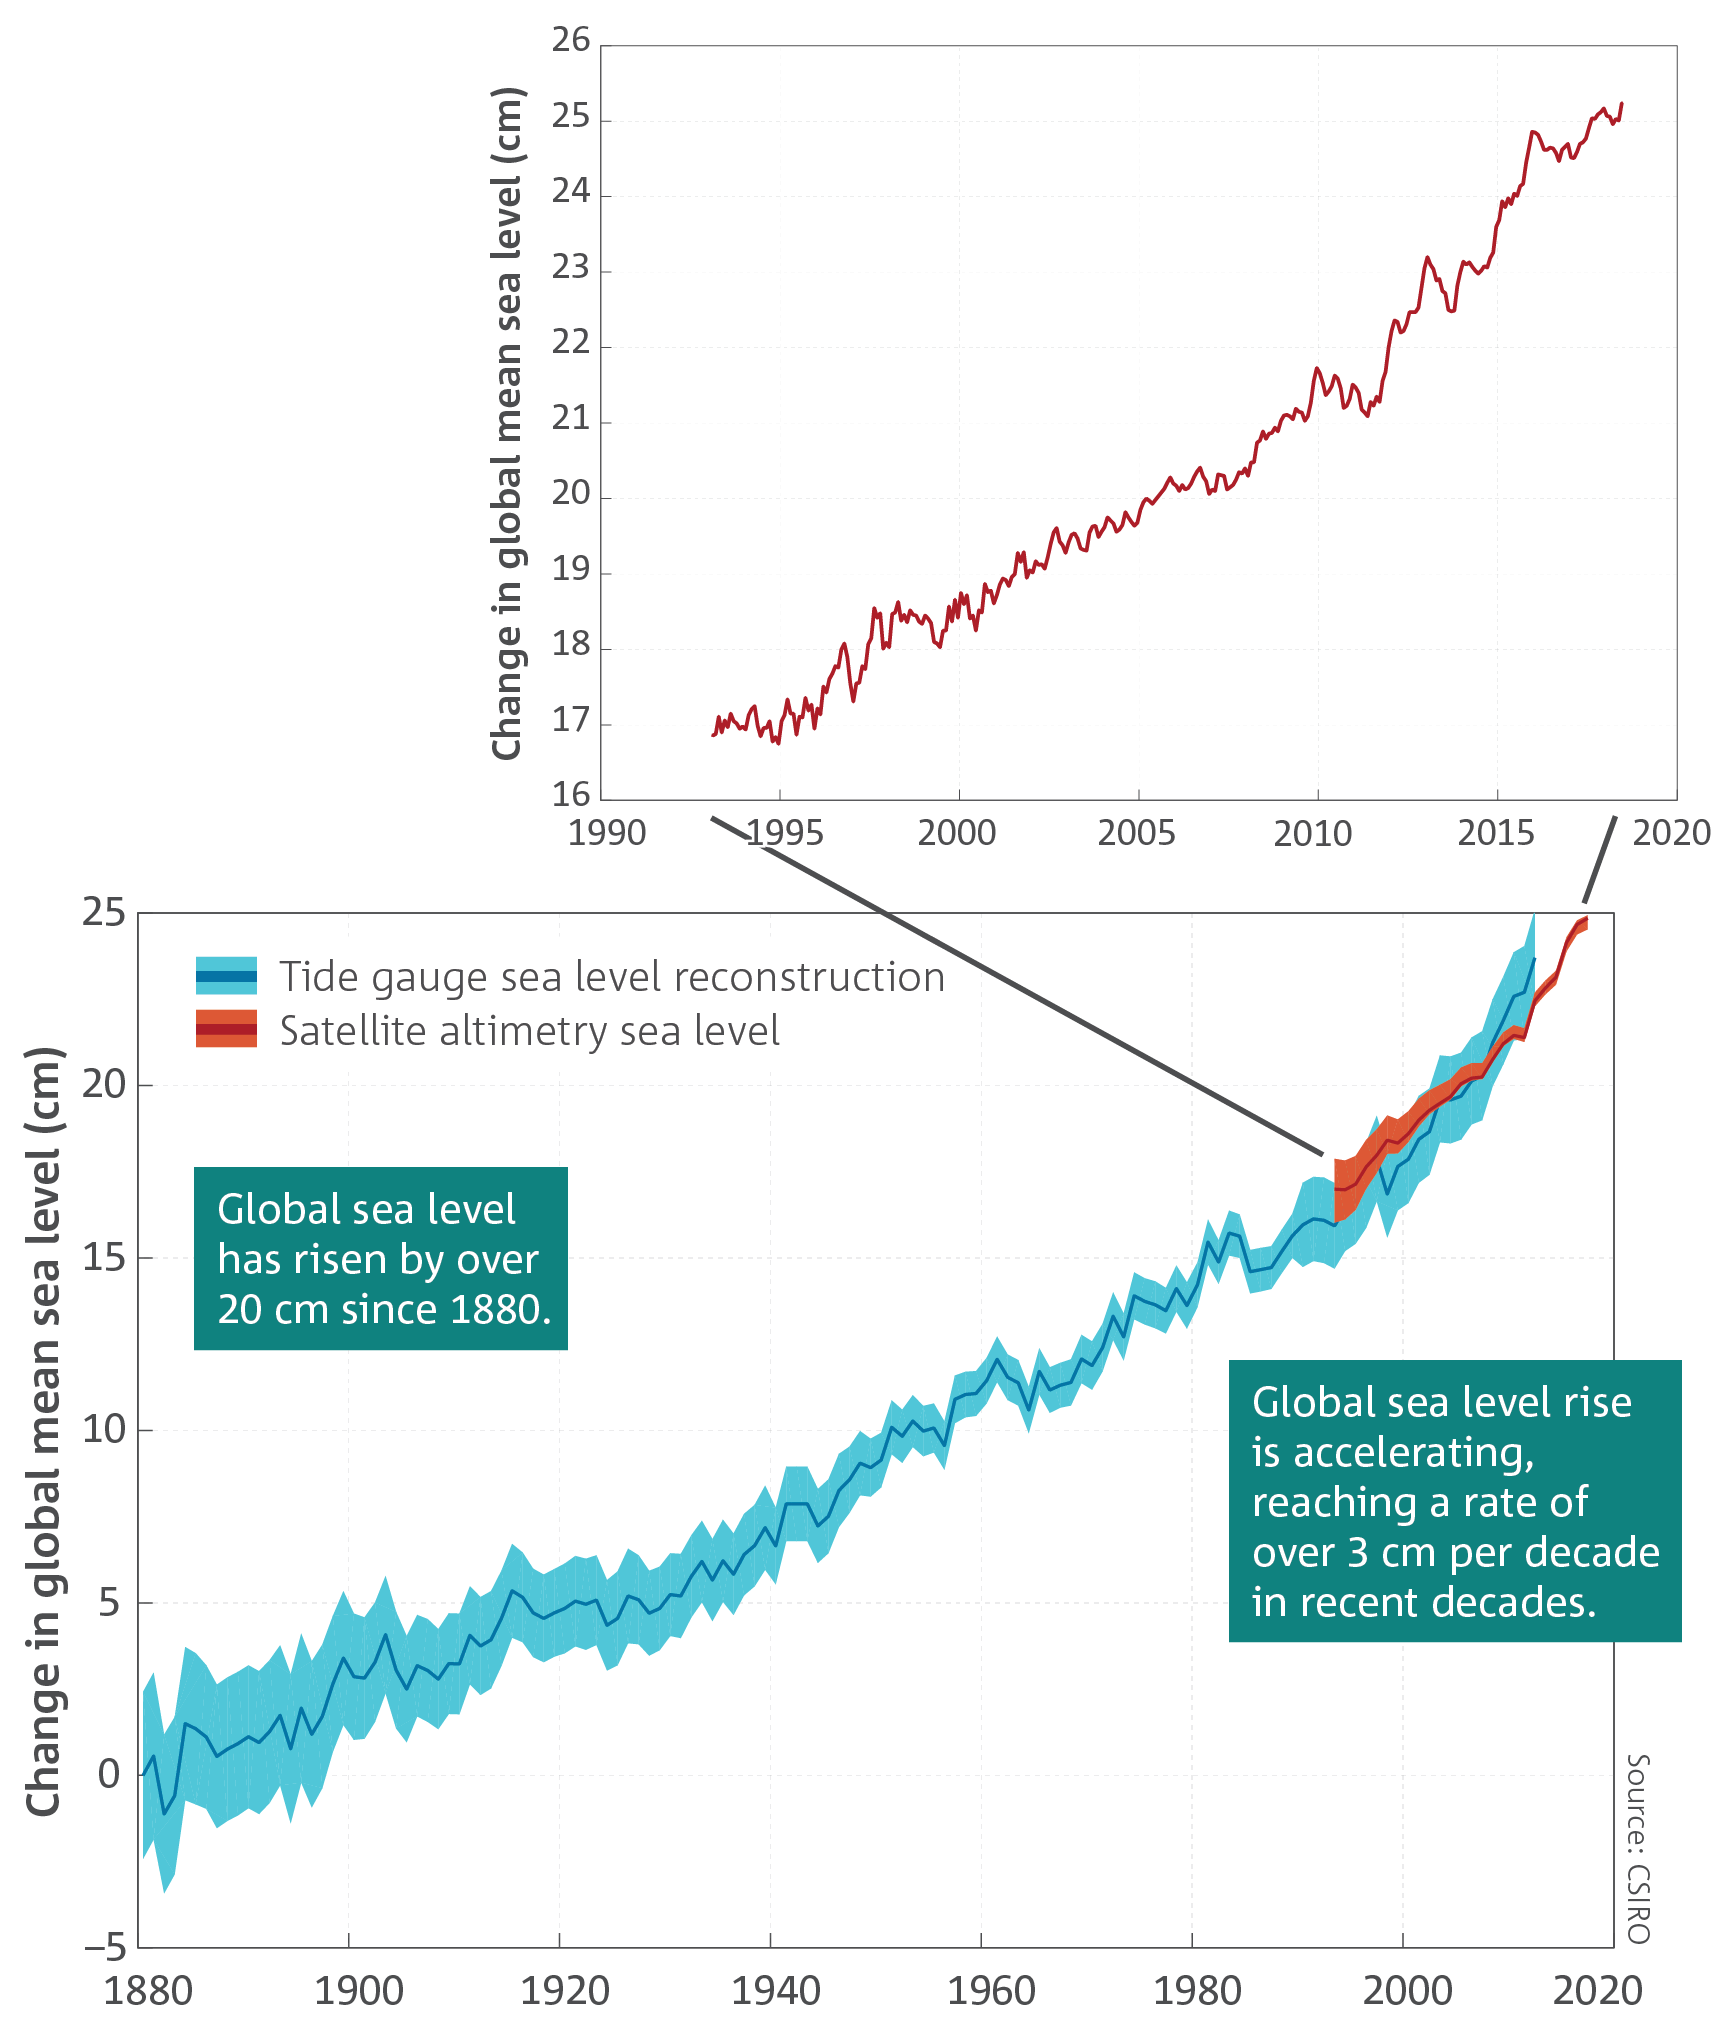 As the ocean warms it expands and sea level rises. This has contributed about a third of the observed global sea level rise of over 20 cm since the late 19th Century. The remainder comes from the loss of ice from glaciers and polar ice sheets, and changes in the amount of water stored on the land. The confidence range of global sea level change has continuously improved because there has been more analysis of satellite altimetry, the time series has lengthened, and the various contributions to sea level have now all been reliably quantified and accounted for. Since 1993 sea level has been rising at 3.2 cm per decade.
Sea level has been rising around Australia. Sea level rise varies from year to year and from place to place. This is partly due to the natural variability of the climate system from influences such as El Niño, La Niña and the Pacific Decadal Oscillation. 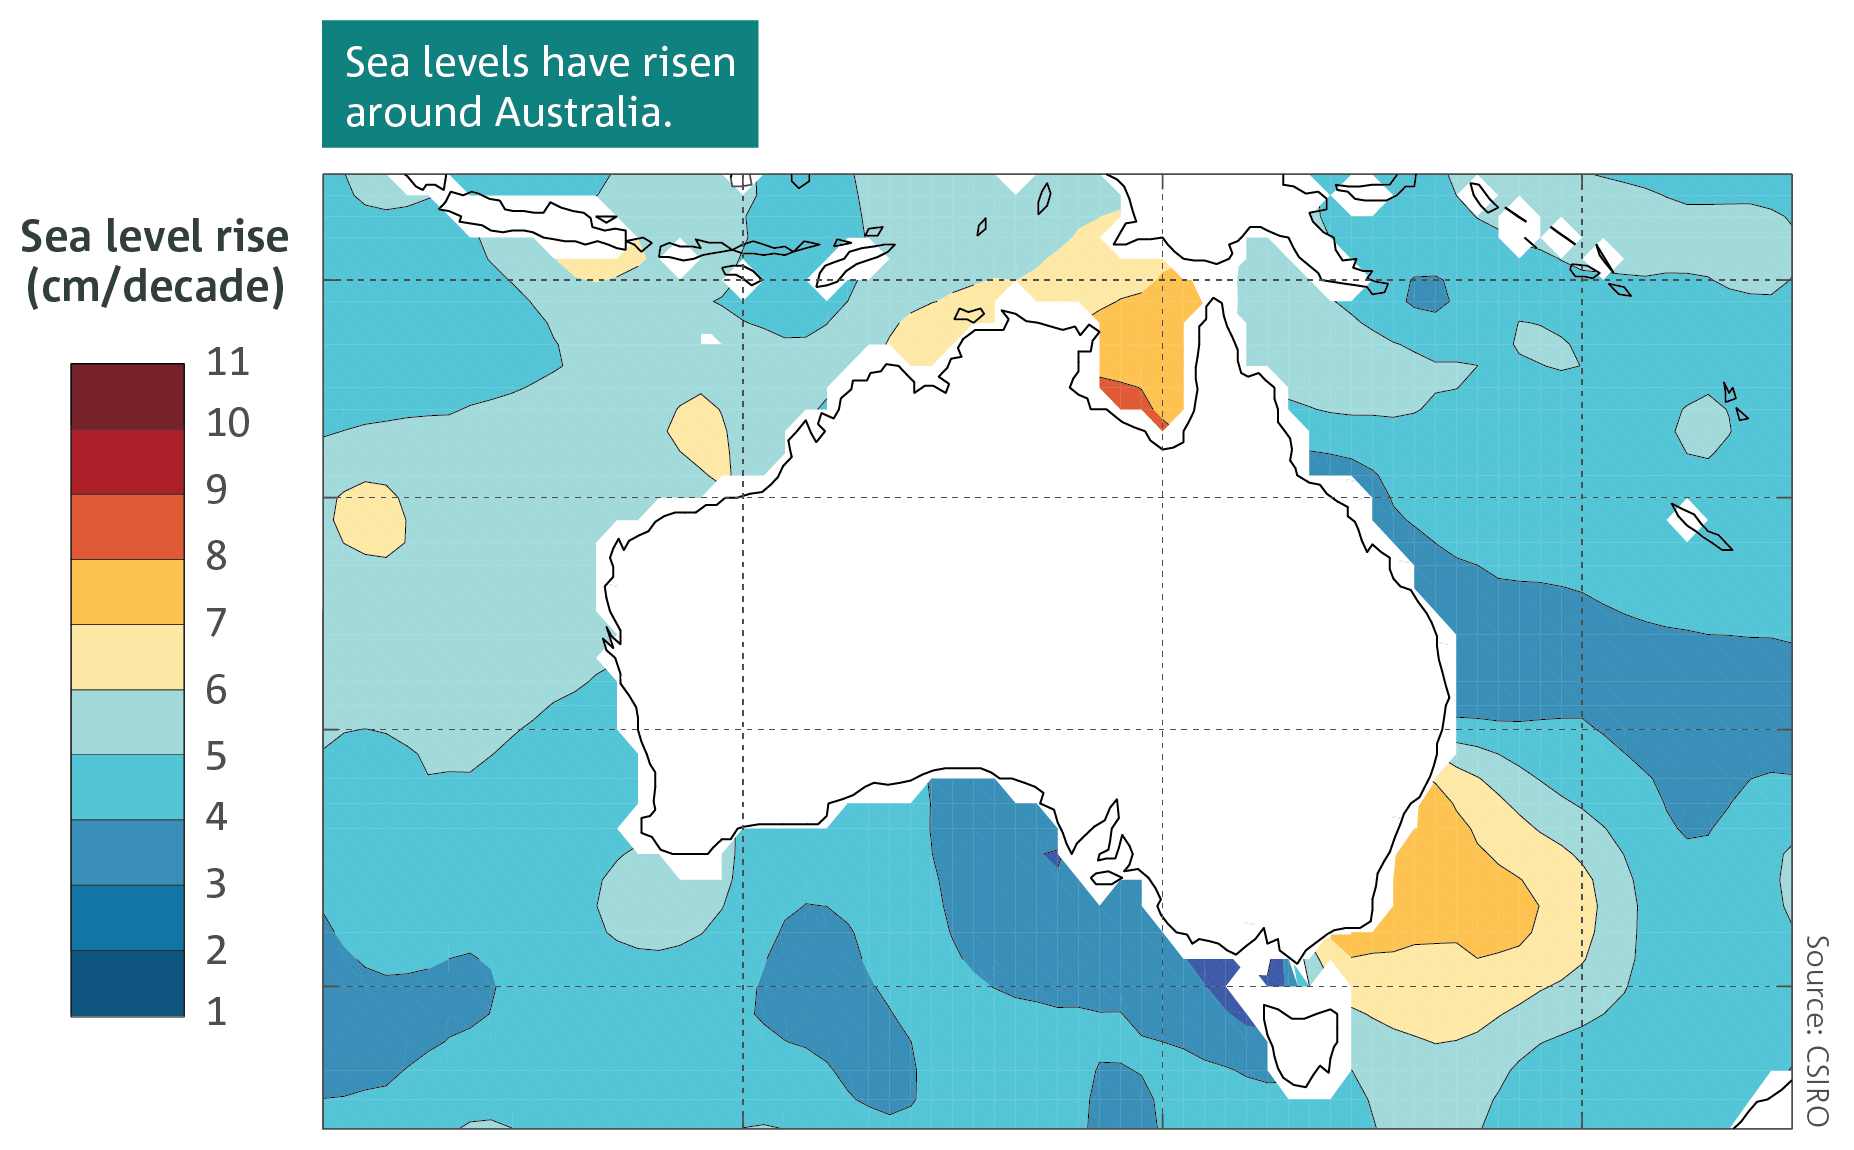 Based on the satellite altimetry observations since 1993, the rates of sea level rise to the northwest, north and southeast of Australia have been higher than the global average, while rates of sea level rise along the south and northeast coasts of the continent have been close to or slightly less than the global average.
The longer-term satellite record is restricted to offshore (at least 25 km off the coast) and does not include estimates of sea level rise along Australia’s coasts, where changes are instead measured from tide gauge data. Changes in sea level measured by tide gauges may be different from those measured by satellites due to coastal processes, vertical land motion or changes to the surveyed reference level of the tide records (e.g. a site change). These factors introduce some uncertainty to rates of change in sea level experienced at the coast. Nevertheless, tide gauges with good long-term records around Australia show consistent sea level rise over time.
Ocean acidification
- The oceans around Australia are acidifying (the pH is decreasing).
- The changes in ocean acidification have led to detectable impacts in areas such as the Great Barrier Reef.
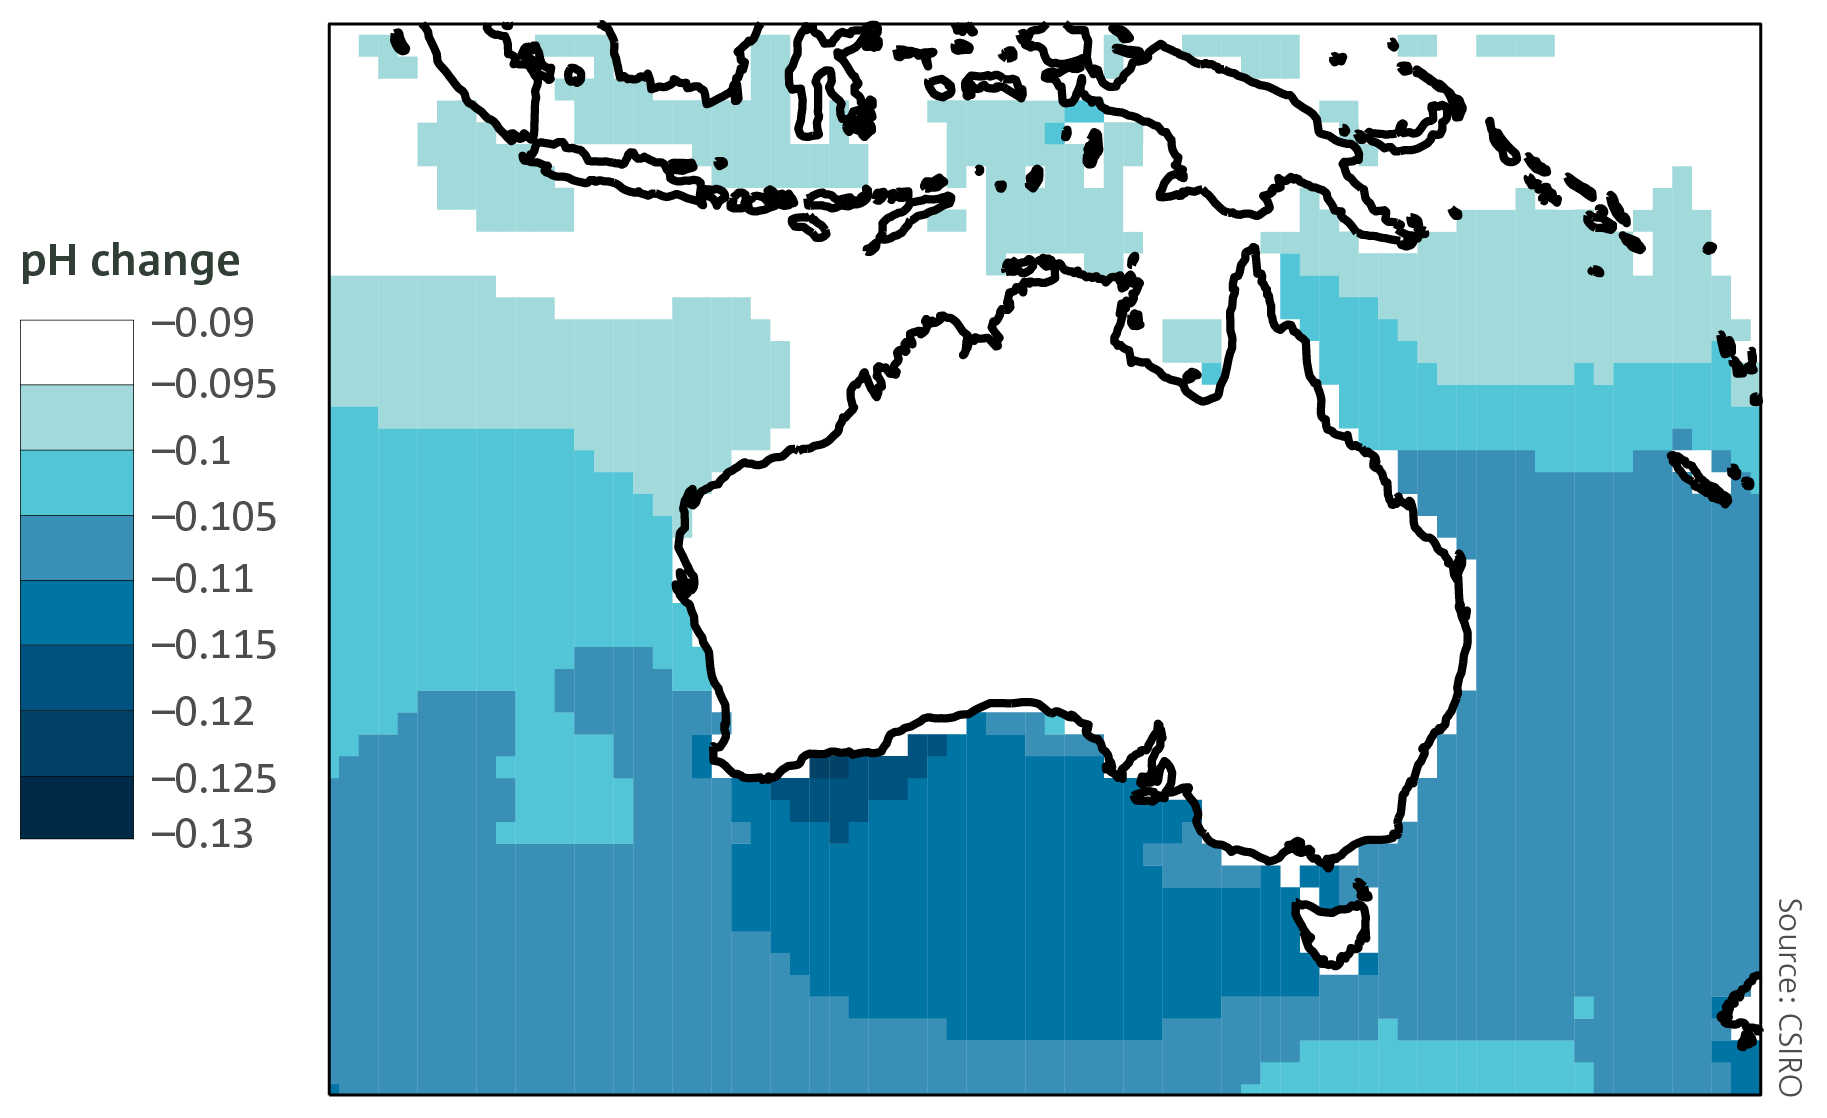
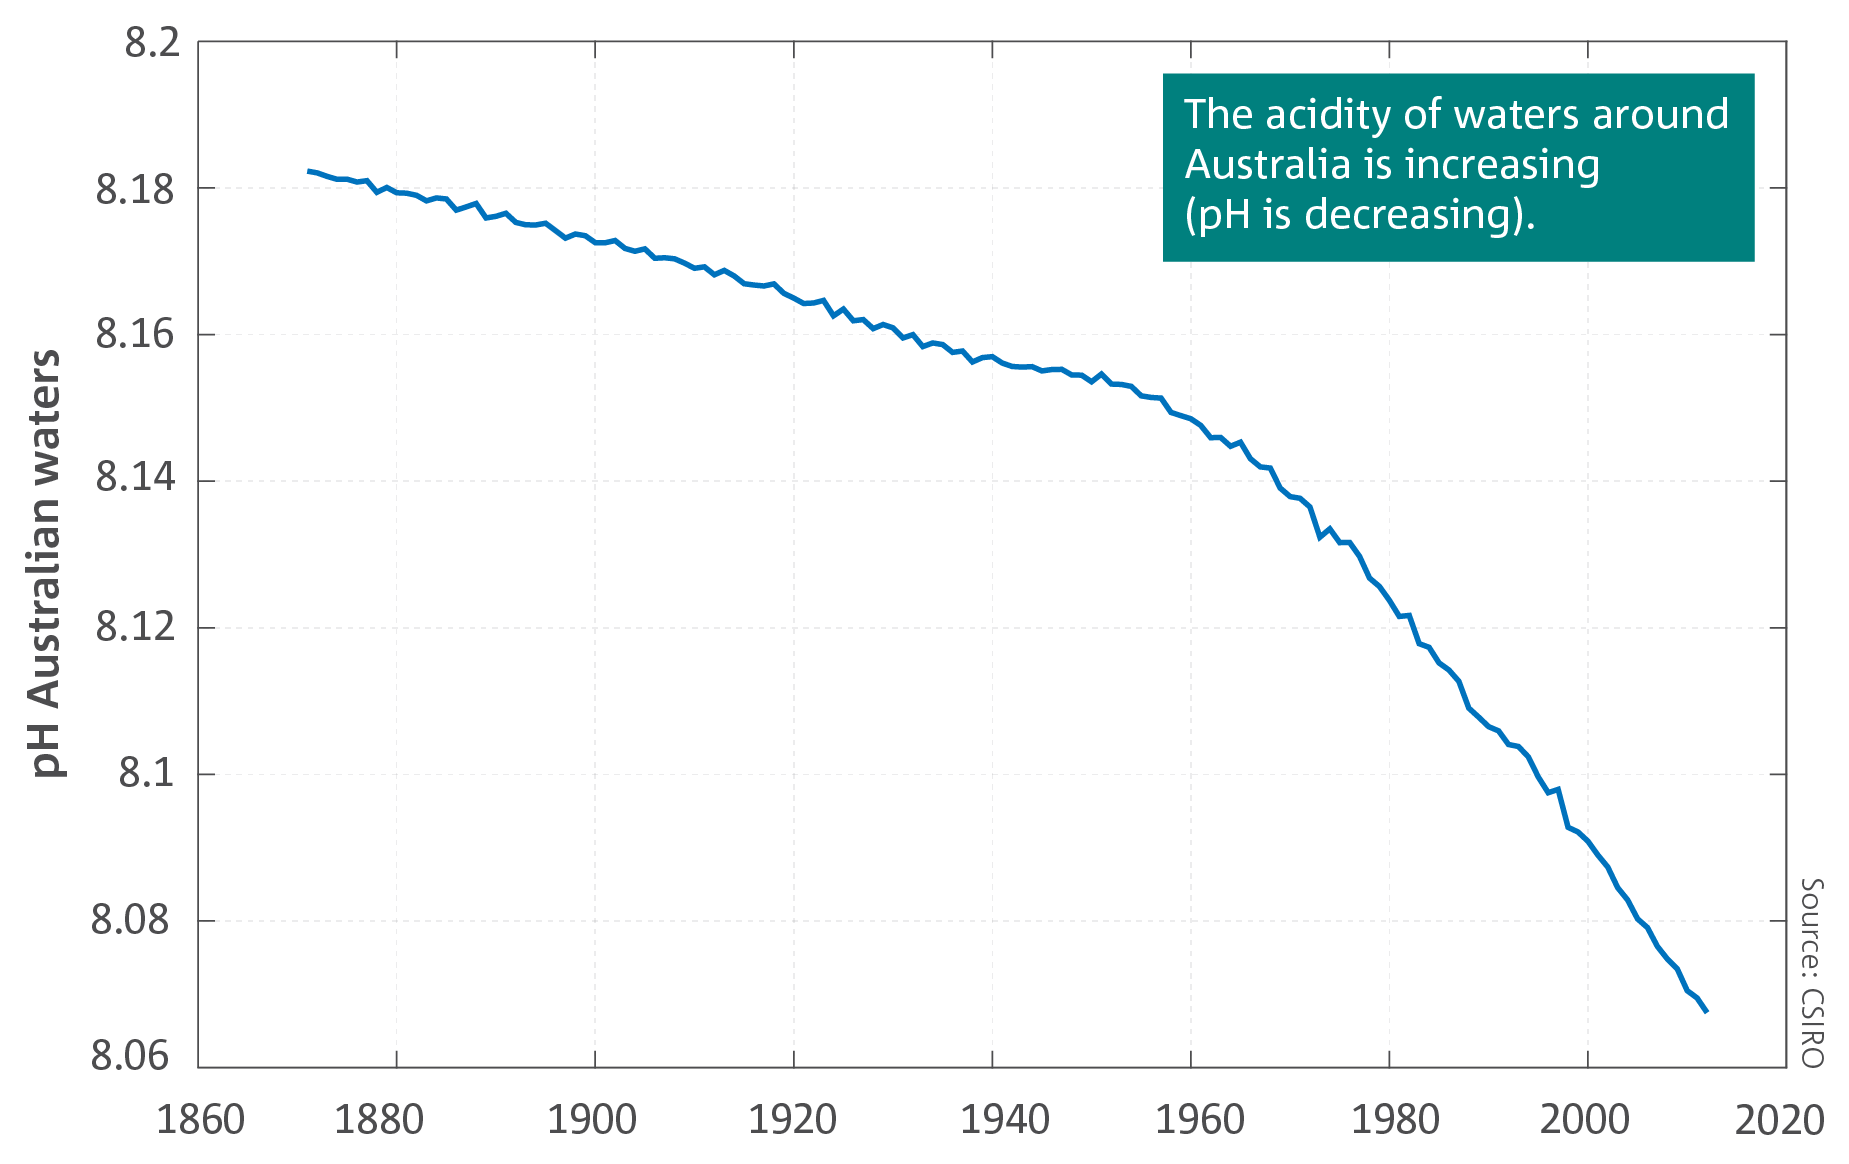 The uptake of atmospheric CO2 by the oceans affects the carbonate chemistry and decreases pH, a process known as ocean acidification. Ocean acidification is the consequence of rising atmospheric CO2 levels and impacts the entire marine ecosystem—from plankton at the base through to the top of the food chain. Impacts include changes in reproduction, organism growth and physiology, species composition and distributions, food web structure, nutrient availability and calcification. The latter is particularly important for species that produce shells, or skeletons of calcium carbonate, such as corals and shellfish. The average pH of surface waters around Australia is estimated to have decreased since the 1880s by about 0.1, corresponding to a more than 30 per cent increase in acidity (the waters have become less alkaline). These changes have led to a reduction in coral calcification and growth rates on the Great Barrier Reef, with implications for recovery from coral bleaching events. The current rate of change is ten times faster than at any time in the past 300 million years. Due to the differences in ocean chemistry by latitude, the oceans to the south of Australia are acidifying faster than those to the north.
Cryosphere
The ice sheets and ice shelves of Antarctica and Greenland are losing ice due to a warmer climate; sea-ice extent has reduced in the Arctic.
Changes have been observed in the ice sheets and ice shelves around Antarctica, with glaciers retreating in West Antarctica and melting of the underside of ice shelves to the west of the Antarctic Peninsula. Floating ice shelves help to stabilise the Antarctic ice sheet, by restricting the flow of glacial ice from the continent to the ocean. Warm ocean water penetrating below the ice shelves of the West Antarctic ice sheet is destabilising a number of glaciers, increasing the Antarctic contribution to sea level rise. Latest estimates for the Antarctic ice sheet show a loss of 2720 ± 1390 million tonnes from 1992 to 2017, corresponding to an increase in global mean sea level of 7.6 ± 3.9 mm (approximately 10 per cent of the total). Melting of the Greenland ice sheet has increased dramatically, from an average of 34 million tonnes (Gt) per year during 1992–2001 to 215 Gt per year over 2002–2011.
Changes in sea ice have little direct impact on sea level because sea ice is frozen sea water that floats and when it melts it returns the original volume of water to the sea. However, the presence or absence of sea ice can influence the climate and can also be an indicator of wider climate changes.
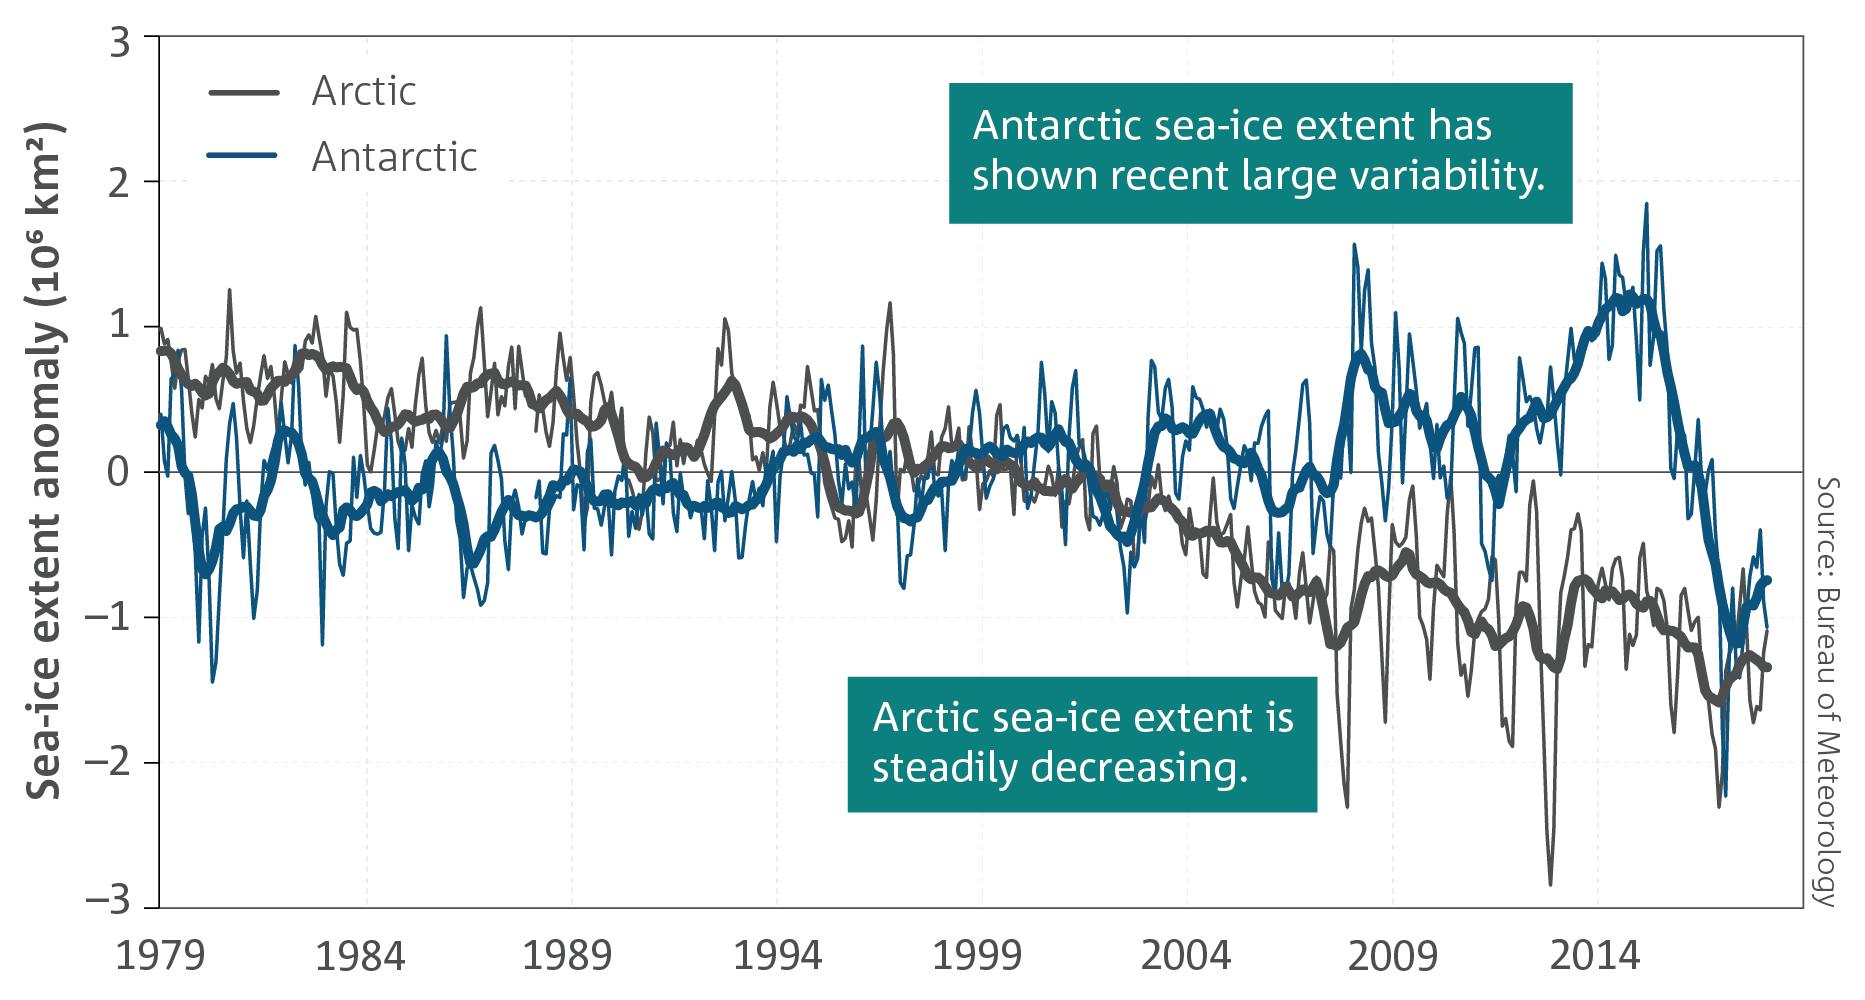
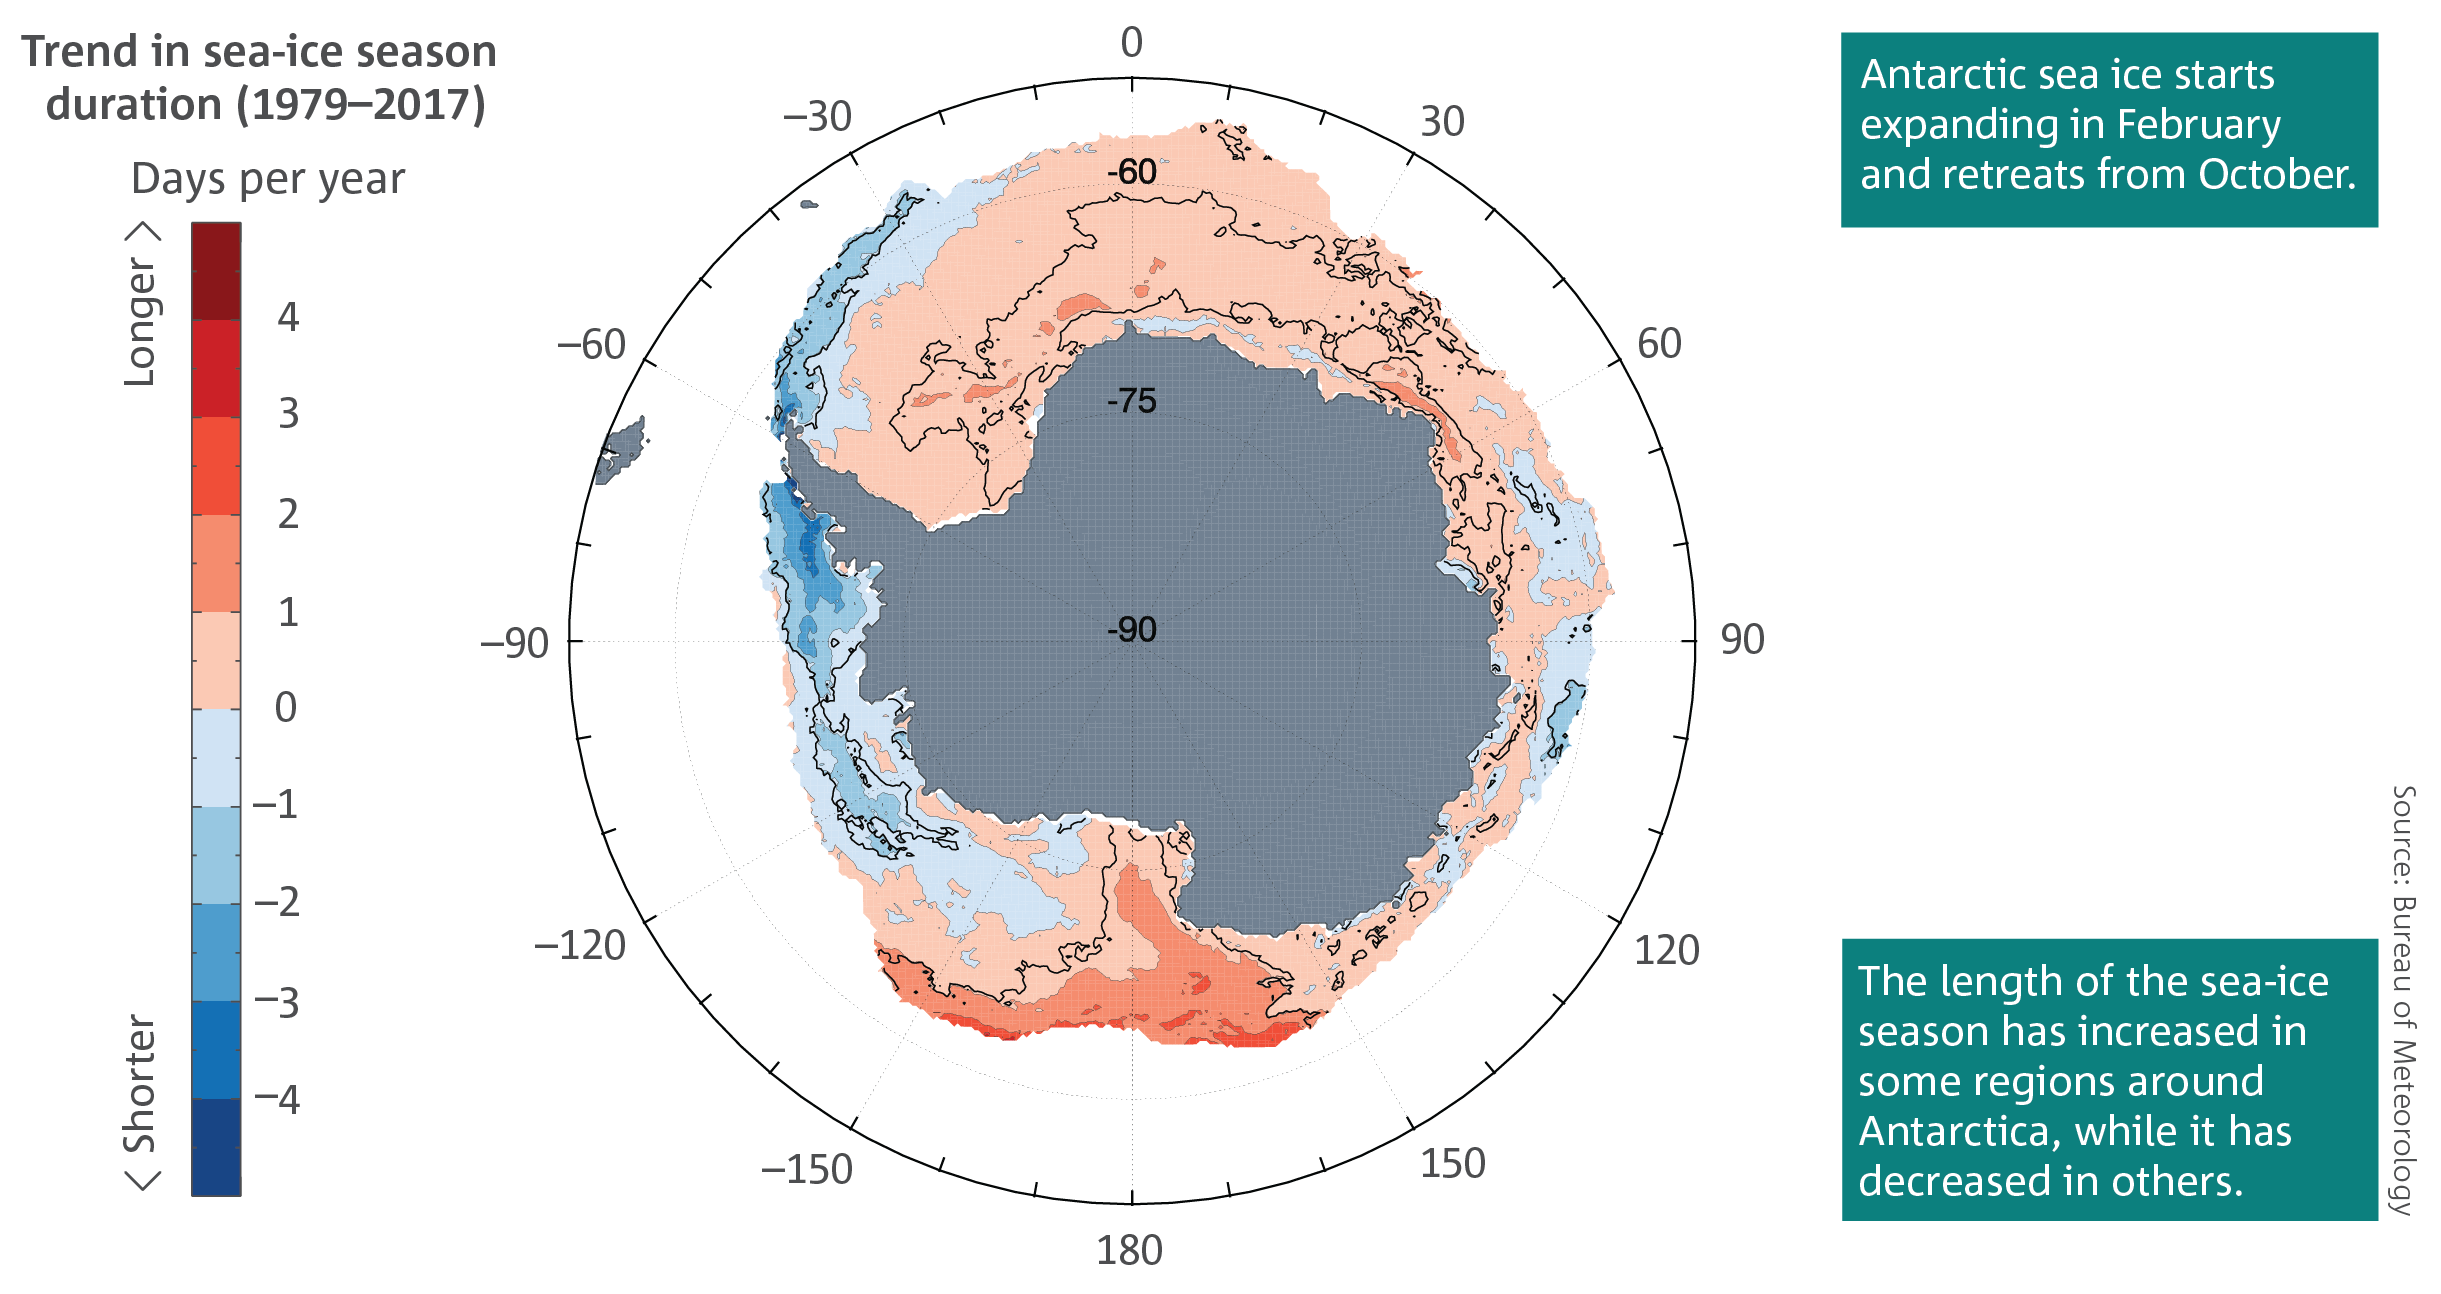
Changes in Antarctic sea ice are complex, with statistically significant increases in extent and seasonal duration in some regions—particularly in the Ross Sea, between 160° E and 150° W—and decreases in others—particularly to the west of the Antarctic Peninsula in the Bellingshausen Sea. The duration of the sea-ice season has changed by up to four months over the 38 years of record in these regions. Sea-ice extent around Antarctica has significant inter-annual variability. Between 1979 and 2014 the net sea-ice extent showed a positive trend, with substantial regional variations, however since then sea-ice coverage has been predominantly below average. Over the long term, sea-ice coverage responds to large-scale atmospheric and oceanic changes. The overall increase in sea-ice extent since 1979 has mostly been attributed to changes in westerly wind strength. The largest recorded wintertime extent of approximately 20.2 billion km2 was recorded on 20 September 2014, closely followed by the lowest recorded summertime extent of approximately 2.1 billion km2 on 1 March 2017. These trends and the large variability are due to many factors including changes in winds over the Southern Ocean and near the Antarctic continent, and changes in ocean surface temperature and salinity. More observations are needed to determine if the recent decrease in sea-ice extent is the start of a long-term trend or a short-term change.
The sea-ice extent in the Arctic Ocean has decreased 3.5–4.1 per cent per decade since satellite records began in 1979. The four lowest wintertime maximum Arctic sea-ice extents in the satellite record have all occurred in the past four years. The record low minimum Arctic sea-ice extent occurred in September 2012.
Why are Australia and the Earth warming?
Energy comes from the Sun. To maintain stable temperatures at the Earth’s surface this incoming energy must be balanced in the longer-term by an equal amount of heat radiated back to space. Greenhouse gases in the atmosphere, such as carbon dioxide and methane, make it harder for the Earth to radiate this heat, so increase the temperature of the Earth’s surface, ocean and atmosphere. This is called the greenhouse effect. Without any greenhouse gases, the Earth’s surface would be much colder, with an average temperature of about –18 °C. For centuries prior to industrialisation the incoming sunlight and outgoing heat were balanced, and global average temperatures were relatively steady, at a little under 15 °C. Now, mostly because of the burning of fossil fuels and changes in land use, the concentrations of greenhouse gases in the atmosphere are rising and causing surface temperatures to increase, leading to an ‘enhanced’ greenhouse effect. There is now an energy imbalance at the Earth’s surface of around 0.7–0.8 Wm–2 (averaged globally). The atmosphere and oceans will continue to warm until enough extra heat can escape to space to allow the Earth to return to balance. Because increased levels of carbon dioxide persist in the atmosphere for hundreds of years, further warming and sea level rise is inevitable.
Sea surface temperature
The ocean surface around Australia has warmed, contributing to longer and more frequent marine heatwaves
The ocean surface around Australia has warmed over recent decades at a similar rate to the air temperature. Sea surface temperature in the Australian region has warmed by around 1 °C since 1910, with eight of the ten warmest years on record occurring since 2010.
Part of the East Australian Current now extends further south, creating an area of more rapid warming in the Tasman Sea. This extension is having numerous impacts on marine ecosystems, including many marine species extending their habitat range further south.
Warming of the ocean has contributed to longer and more frequent periods when the sea surface temperature is in the upper range of historical baseline conditions for five days or more, known as marine heatwaves. There were long and intense marine heatwaves in the Tasman Sea and around southeast Australia and Tasmania from September 2015 to May 2016 and from November 2017 to March 2018. Scientific analysis shows that the severity of both events can be attributed to anthropogenic climate change. Recent marine heatwaves are linked to coral bleaching in the Great Barrier Reef (see box on page 12).
Ocean heat content
The world’s oceans are taking up more than 90 per cent of the extra energy stored by the planet as a result of enhanced greenhouse gas concentrations, and the southern hemisphere oceans have taken up the majority of this heat.
The world’s oceans play a critical role in the climate system. More than 90 per cent of the additional energy arising from the enhanced greenhouse effect is taken up by the ocean, slowing down the rate of warming at the Earth’s surface. Heat is absorbed at the surface and then moves to the deep ocean in those regions where currents move water vertically. As a result, the ocean is warming both near the surface and at depth, with the rate varying between regions and depths.
The upper ocean is more extensively measured than the deep ocean. Between 1960 and 2017 the global ocean between the surface and a depth of 700 m gained 24 x 1022 joules of additional heat. This is more than 60 per cent of the heat accumulated over the full depth of the ocean. Due to the location of currents that move water vertically, the southern hemisphere oceans have taken up the majority of the heat, including the Southern Ocean to the south of Australia.
The rate at which the deep ocean below 700 m is warming is slow but steady, compared to the more variable rate of change in the upper ocean. Long-term trends in the deep ocean show a clear warming, however there are far fewer observations below 2000 m than near the surface, so the magnitude of this warming is less certain. The observation coverage in the deep ocean will dramatically increase in coming years as the newest generation of observing technology becomes operational, including the automated samplers known as ARGO floats with an extended depth range down to 6000 m.
Ocean heat and coral reefs
Warming ocean temperatures and an increase in the frequency and intensity of marine heatwaves pose a major threat to the long-term health and resilience of coral reef ecosystems. Globally, large-scale mass coral bleaching events have occurred with increasing frequency and extent since the latter decades of the 20th Century. Bleaching is a stress response of corals, as the water warms the symbiotic relationship between the coral and its zooxanthellae breaks down, turning corals pale. Without these zooxanthellae, most corals struggle to survive, and can ultimately die if the thermal stress is too severe or prolonged.
Bleaching on the Great Barrier Reef has occurred in the past, but with increased frequency and extent in recent decades. Widespread bleaching was observed in 1998, driven by higher summer temperatures associated with a strong El Niño combined with long-term warming trends. The last two years (2016 and 2017) have seen mass bleaching over parts of the Reef in consecutive years for the first time, with the northern Great Barrier Reef experiencing bleaching in both summers.
In February to May 2016, the bleaching was associated with some of the warmest sea surface temperatures ever recorded, with temperatures well above the long-term monthly averages in February, March and April. As a result, 30 per cent of all coral cover across the entire Great Barrier Reef was lost, and 50 per cent in the northern third was lost between March and November 2016. This was four times greater than previous mass-bleaching events in 2002 and 1998.
A second mass bleaching occurred in 2017 linked to another marine heatwave, with temperatures again well above the long-term mean.
Both events could have been more extensive in the Southern Great Barrier Reef if it were not for cooling winds associated with distant tropical cyclones Winston and Tatiana in 2016 and tropical cyclone Debbie in 2017.
The primary cause of both marine heatwaves and mass bleaching events was very likely due to warming oceans as a result of anthropogenic climate change, compounded in early 2016 by a very strong El Niño event.
Sea level
- Global sea level has risen by over 20 cm since 1880, and the rate has been accelerating in recent decades.
- Rates of sea level rise vary around Australia.
As the ocean warms it expands and sea level rises. This has contributed about a third of the observed global sea level rise of over 20 cm since the late 19th Century. The remainder comes from the loss of ice from glaciers and polar ice sheets, and changes in the amount of water stored on the land. The confidence range of global sea level change has continuously improved because there has been more analysis of satellite altimetry, the time series has lengthened, and the various contributions to sea level have now all been reliably quantified and accounted for. Since 1993 sea level has been rising at 3.2 cm per decade.
Sea level has been rising around Australia. Sea level rise varies from year to year and from place to place. This is partly due to the natural variability of the climate system from influences such as El Niño, La Niña and the Pacific Decadal Oscillation. Based on the satellite altimetry observations since 1993, the rates of sea level rise to the northwest, north and southeast of Australia have been higher than the global average, while rates of sea level rise along the south and northeast coasts of the continent have been close to or slightly less than the global average.
The longer-term satellite record is restricted to offshore (at least 25 km off the coast) and does not include estimates of sea level rise along Australia’s coasts, where changes are instead measured from tide gauge data. Changes in sea level measured by tide gauges may be different from those measured by satellites due to coastal processes, vertical land motion or changes to the surveyed reference level of the tide records (e.g. a site change). These factors introduce some uncertainty to rates of change in sea level experienced at the coast. Nevertheless, tide gauges with good long-term records around Australia show consistent sea level rise over time.
Ocean acidification
- The oceans around Australia are acidifying (the pH is decreasing).
- The changes in ocean acidification have led to detectable impacts in areas such as the Great Barrier Reef.
The uptake of atmospheric CO2 by the oceans affects the carbonate chemistry and decreases pH, a process known as ocean acidification. Ocean acidification is the consequence of rising atmospheric CO2 levels and impacts the entire marine ecosystem—from plankton at the base through to the top of the food chain. Impacts include changes in reproduction, organism growth and physiology, species composition and distributions, food web structure, nutrient availability and calcification. The latter is particularly important for species that produce shells, or skeletons of calcium carbonate, such as corals and shellfish. The average pH of surface waters around Australia is estimated to have decreased since the 1880s by about 0.1, corresponding to a more than 30 per cent increase in acidity (the waters have become less alkaline). These changes have led to a reduction in coral calcification and growth rates on the Great Barrier Reef, with implications for recovery from coral bleaching events. The current rate of change is ten times faster than at any time in the past 300 million years. Due to the differences in ocean chemistry by latitude, the oceans to the south of Australia are acidifying faster than those to the north.
Cryosphere
The ice sheets and ice shelves of Antarctica and Greenland are losing ice due to a warmer climate; sea-ice extent has reduced in the Arctic.
Changes have been observed in the ice sheets and ice shelves around Antarctica, with glaciers retreating in West Antarctica and melting of the underside of ice shelves to the west of the Antarctic Peninsula. Floating ice shelves help to stabilise the Antarctic ice sheet, by restricting the flow of glacial ice from the continent to the ocean. Warm ocean water penetrating below the ice shelves of the West Antarctic ice sheet is destabilising a number of glaciers, increasing the Antarctic contribution to sea level rise. Latest estimates for the Antarctic ice sheet show a loss of 2720 ± 1390 million tonnes from 1992 to 2017, corresponding to an increase in global mean sea level of 7.6 ± 3.9 mm (approximately 10 per cent of the total). Melting of the Greenland ice sheet has increased dramatically, from an average of 34 million tonnes (Gt) per year during 1992–2001 to 215 Gt per year over 2002–2011.
Changes in sea ice have little direct impact on sea level because sea ice is frozen sea water that floats and when it melts it returns the original volume of water to the sea. However, the presence or absence of sea ice can influence the climate and can also be an indicator of wider climate changes.
Changes in Antarctic sea ice are complex, with statistically significant increases in extent and seasonal duration in some regions—particularly in the Ross Sea, between 160° E and 150° W—and decreases in others—particularly to the west of the Antarctic Peninsula in the Bellingshausen Sea. The duration of the sea-ice season has changed by up to four months over the 38 years of record in these regions. Sea-ice extent around Antarctica has significant inter-annual variability. Between 1979 and 2014 the net sea-ice extent showed a positive trend, with substantial regional variations, however since then sea-ice coverage has been predominantly below average. Over the long term, sea-ice coverage responds to large-scale atmospheric and oceanic changes. The overall increase in sea-ice extent since 1979 has mostly been attributed to changes in westerly wind strength. The largest recorded wintertime extent of approximately 20.2 billion km2 was recorded on 20 September 2014, closely followed by the lowest recorded summertime extent of approximately 2.1 billion km2 on 1 March 2017. These trends and the large variability are due to many factors including changes in winds over the Southern Ocean and near the Antarctic continent, and changes in ocean surface temperature and salinity. More observations are needed to determine if the recent decrease in sea-ice extent is the start of a long-term trend or a short-term change.
The sea-ice extent in the Arctic Ocean has decreased 3.5–4.1 per cent per decade since satellite records began in 1979. The four lowest wintertime maximum Arctic sea-ice extents in the satellite record have all occurred in the past four years. The record low minimum Arctic sea-ice extent occurred in September 2012.
Why are Australia and the Earth warming?
Energy comes from the Sun. To maintain stable temperatures at the Earth’s surface this incoming energy must be balanced in the longer-term by an equal amount of heat radiated back to space. Greenhouse gases in the atmosphere, such as carbon dioxide and methane, make it harder for the Earth to radiate this heat, so increase the temperature of the Earth’s surface, ocean and atmosphere. This is called the greenhouse effect. Without any greenhouse gases, the Earth’s surface would be much colder, with an average temperature of about –18 °C. For centuries prior to industrialisation the incoming sunlight and outgoing heat were balanced, and global average temperatures were relatively steady, at a little under 15 °C. Now, mostly because of the burning of fossil fuels and changes in land use, the concentrations of greenhouse gases in the atmosphere are rising and causing surface temperatures to increase, leading to an ‘enhanced’ greenhouse effect. There is now an energy imbalance at the Earth’s surface of around 0.7–0.8 Wm–2 (averaged globally). The atmosphere and oceans will continue to warm until enough extra heat can escape to space to allow the Earth to return to balance. Because increased levels of carbon dioxide persist in the atmosphere for hundreds of years, further warming and sea level rise is inevitable.