Greenhouse gases
- Global average concentrations of all the major long-lived greenhouse gases continue to rise in the atmosphere, with carbon dioxide concentrations rising above 400 ppm since 2016 and the CO2 equivalent of all gases reaching 500 ppm in 2017.
- Emissions from burning fossil fuels continue to increase and are the dominant contributor to the observed growth in atmospheric CO2.
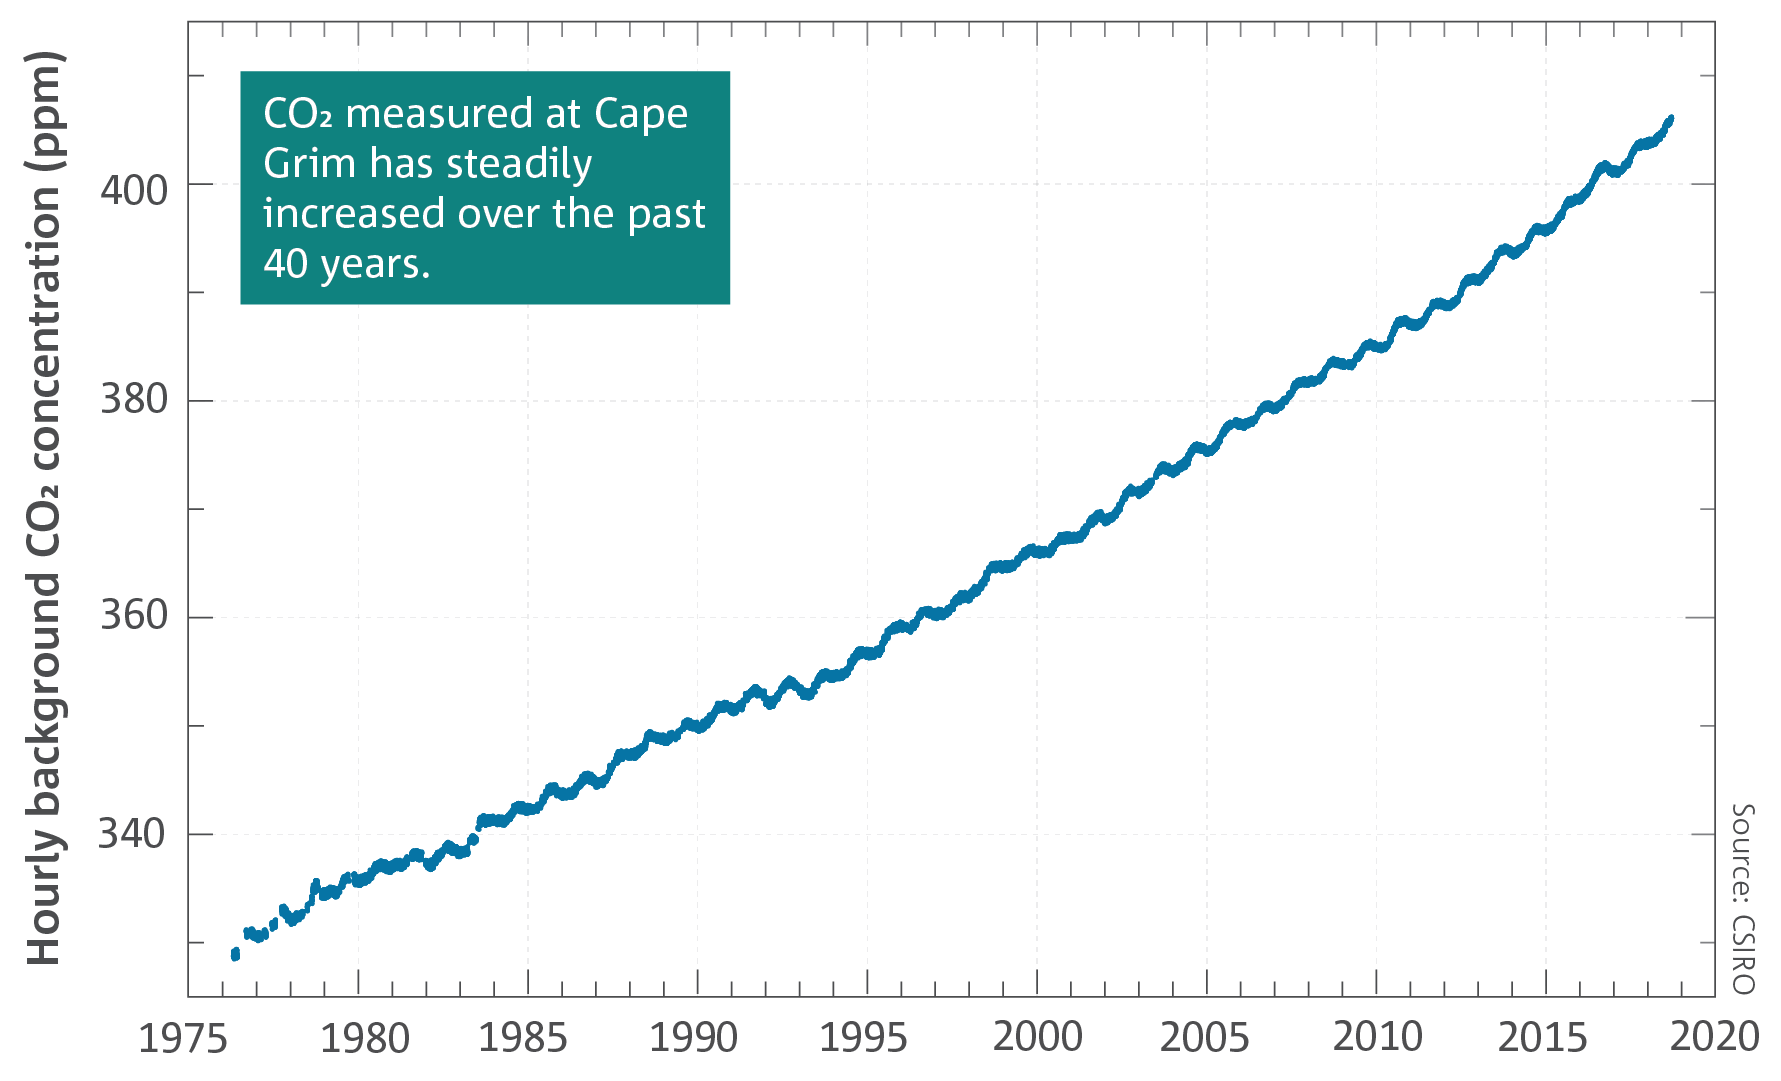
The global annual mean CO2 level in 2017 was 405 ppm—a 46 per cent increase from the concentration of 278 ppm around the year 1750, and likely the highest level in at least the past two million years. Cape Grim, located at the northwest tip of Tasmania, is one of three key global greenhouse gas monitoring stations in the World Meteorological Organization’s Global Atmosphere Watch program, and has been running continuously for 42 years. Atmospheric concentration of CO2 measured at the Cape Grim Baseline Air Pollution Station shows a steady upward trend, passing 400 ppm in May 2016 and remaining above this level since. The annual average CO2 concentration at Cape Grim in 2017 was 402 ppm.
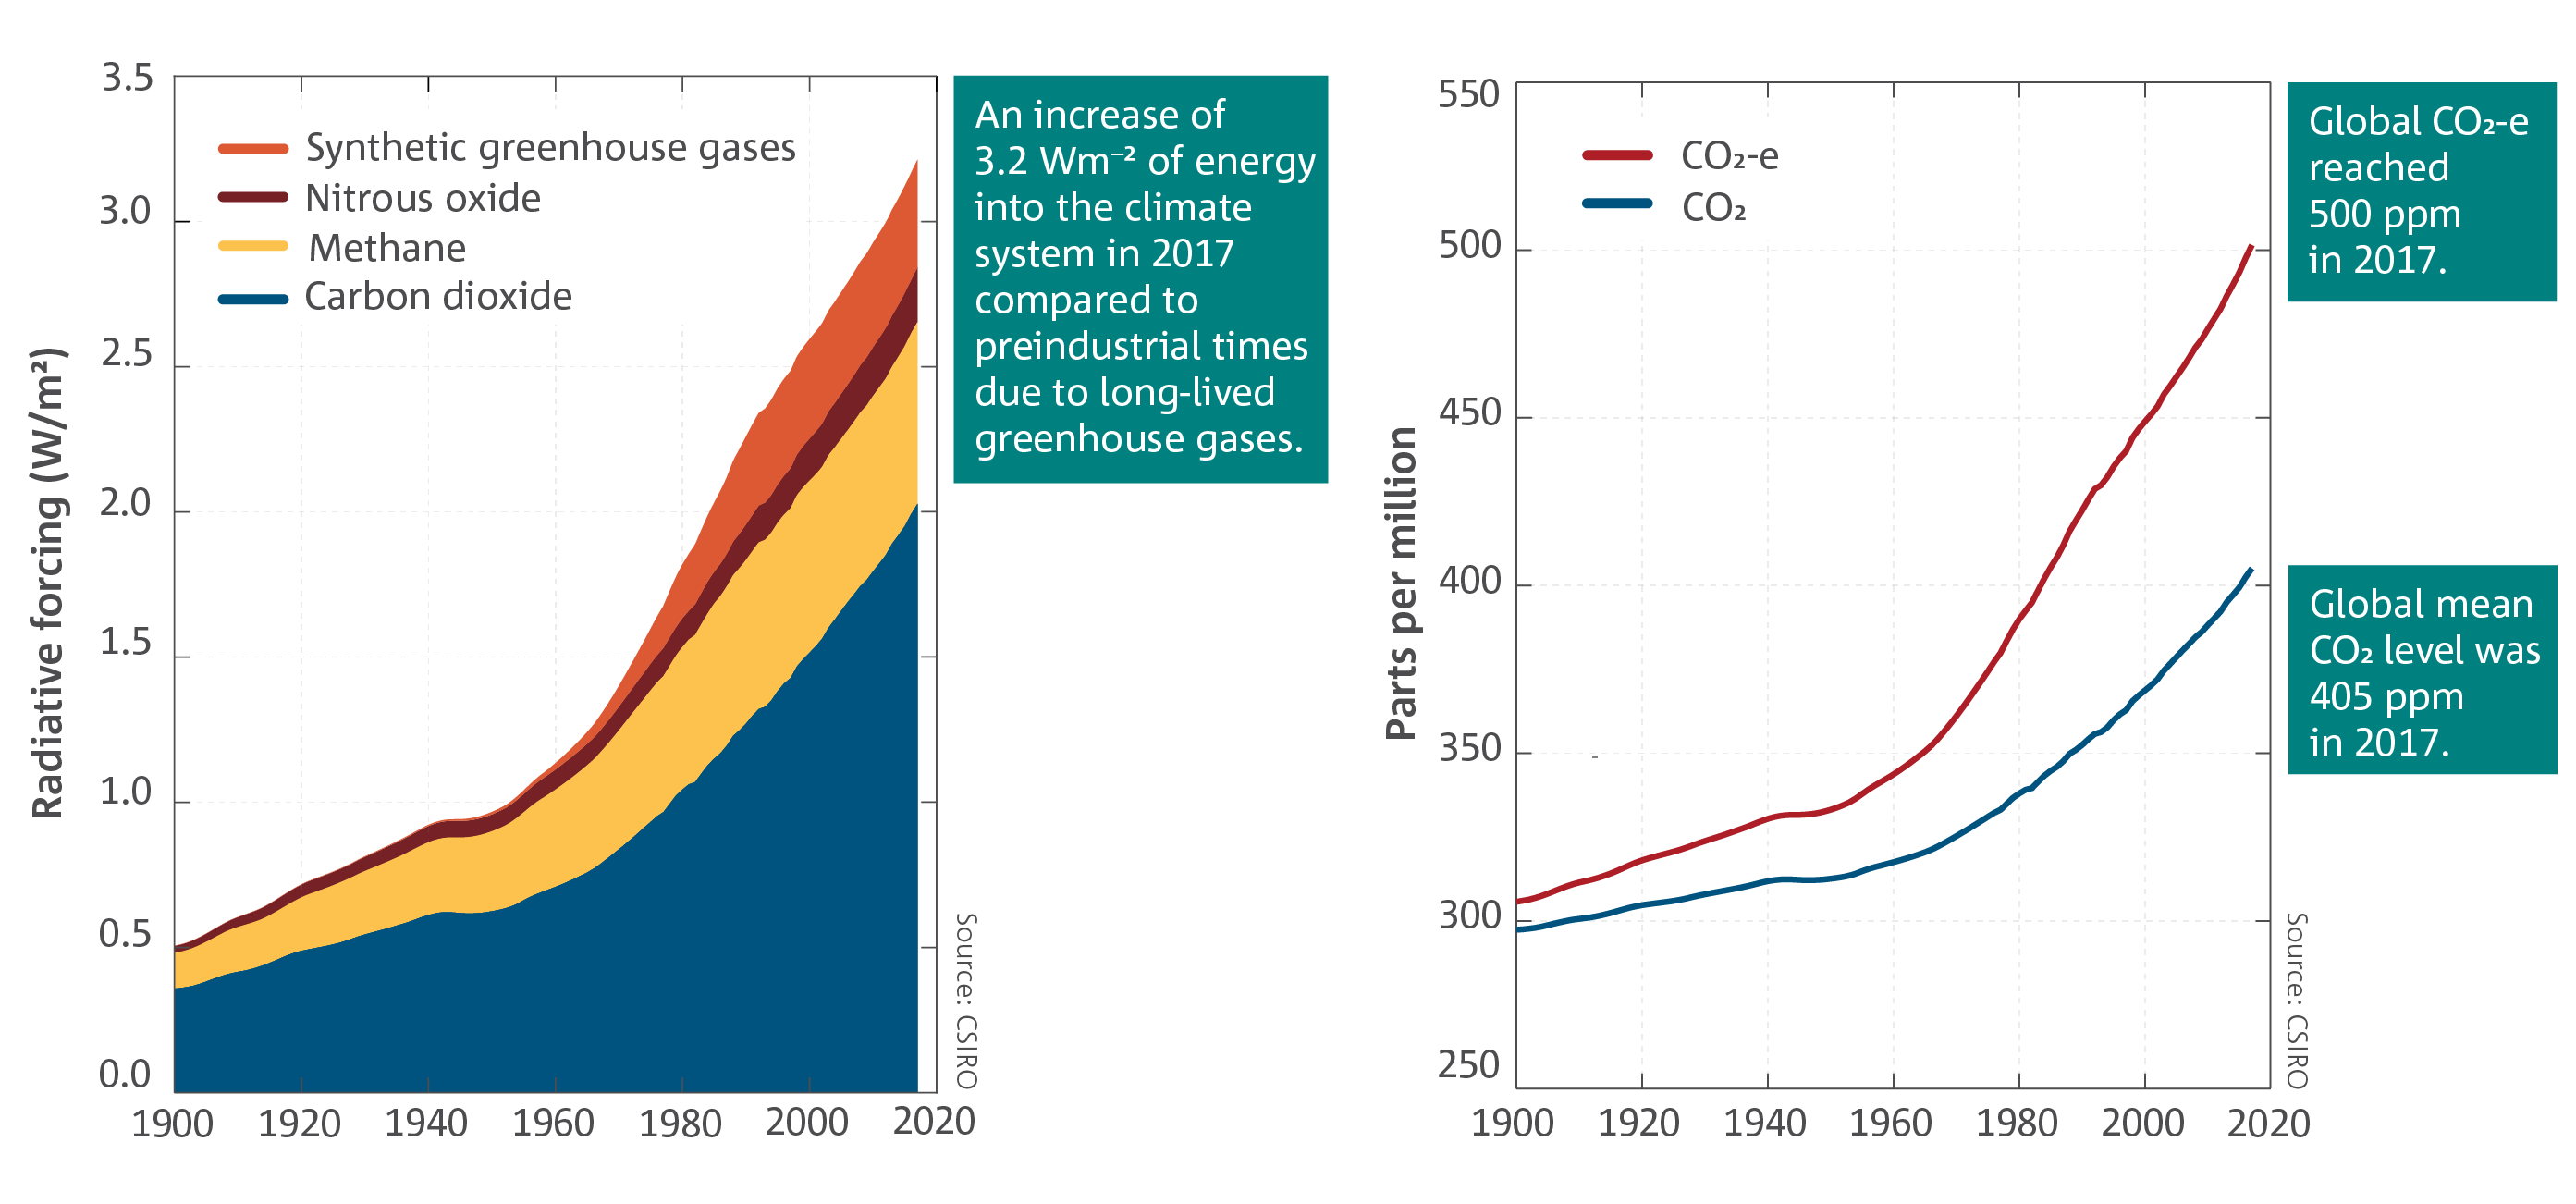
Globally averaged atmospheric concentrations of all major long-lived greenhouse gases, carbon dioxide (CO2), methane (CH4), nitrous oxide (N2O) and a group of synthetic greenhouse gases, continue to rise. The amounts of CO2, CH4 and N2O in the atmosphere show significant seasonal and year-to-year variabilities, but all show ongoing upward trends.
The impact of all the long-lived greenhouse gases in the atmosphere combined can be expressed as an enhancement of the net radiation, or ‘radiative forcing’, in watts per metre squared. CO2 is the largest contributor to this enhancement, but other gases make a significant contribution. The impact of all greenhouse gases can be converted to an ‘equivalent CO2 (CO2-e)’ atmospheric concentration. The global annual average CO2-e reached 501.5 ppm in 2017, and the CO2-e value at Cape Grim reached the 500 ppm milestone in mid-2018.
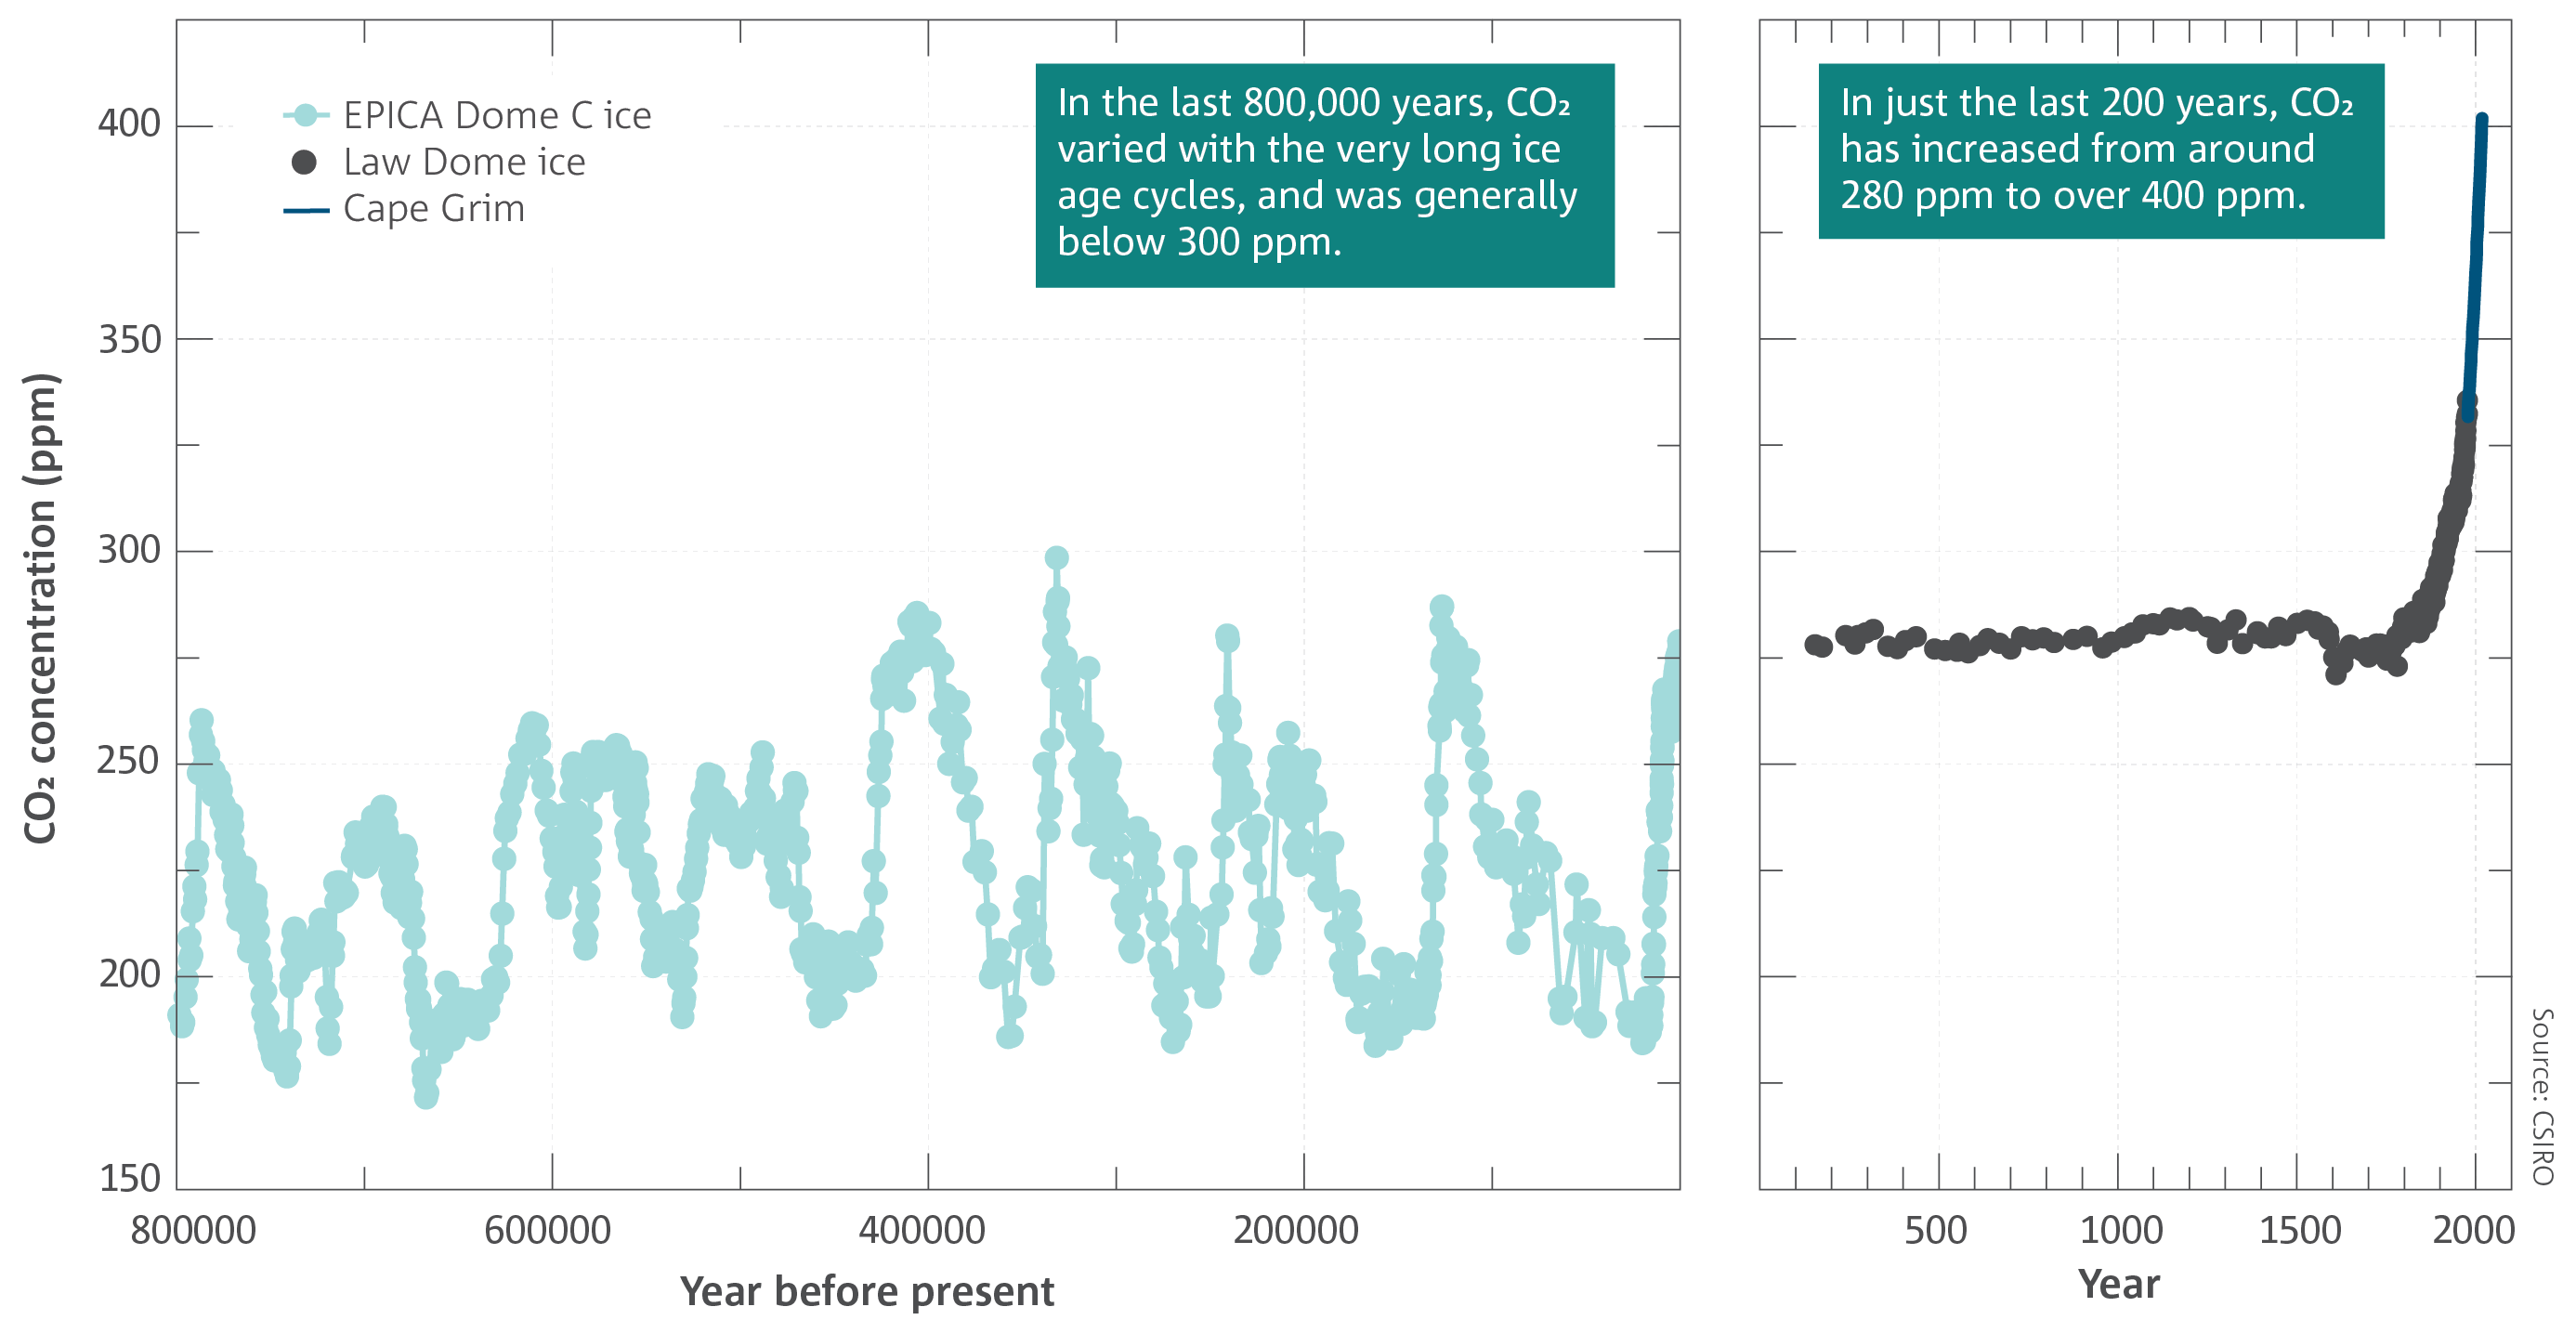
Measurements of air extracted from Antarctic ice extend the record of measured atmospheric CO2 concentrations to 800,000 years ago. Over the past 2000 years, concentrations were around 280 ppm with only small changes until the start of the industrial era, before rapidly increasing. Over the previous 800,000 years, CO2 concentrations varied between regular warm periods and colder glacial periods but were always lower than those of the past century. The last time atmospheric CO2 concentrations were the same or higher than present day was the Pliocene epoch, more than 2.3 million years ago, as determined from isotopes and organic molecule tracers in ocean sediments.
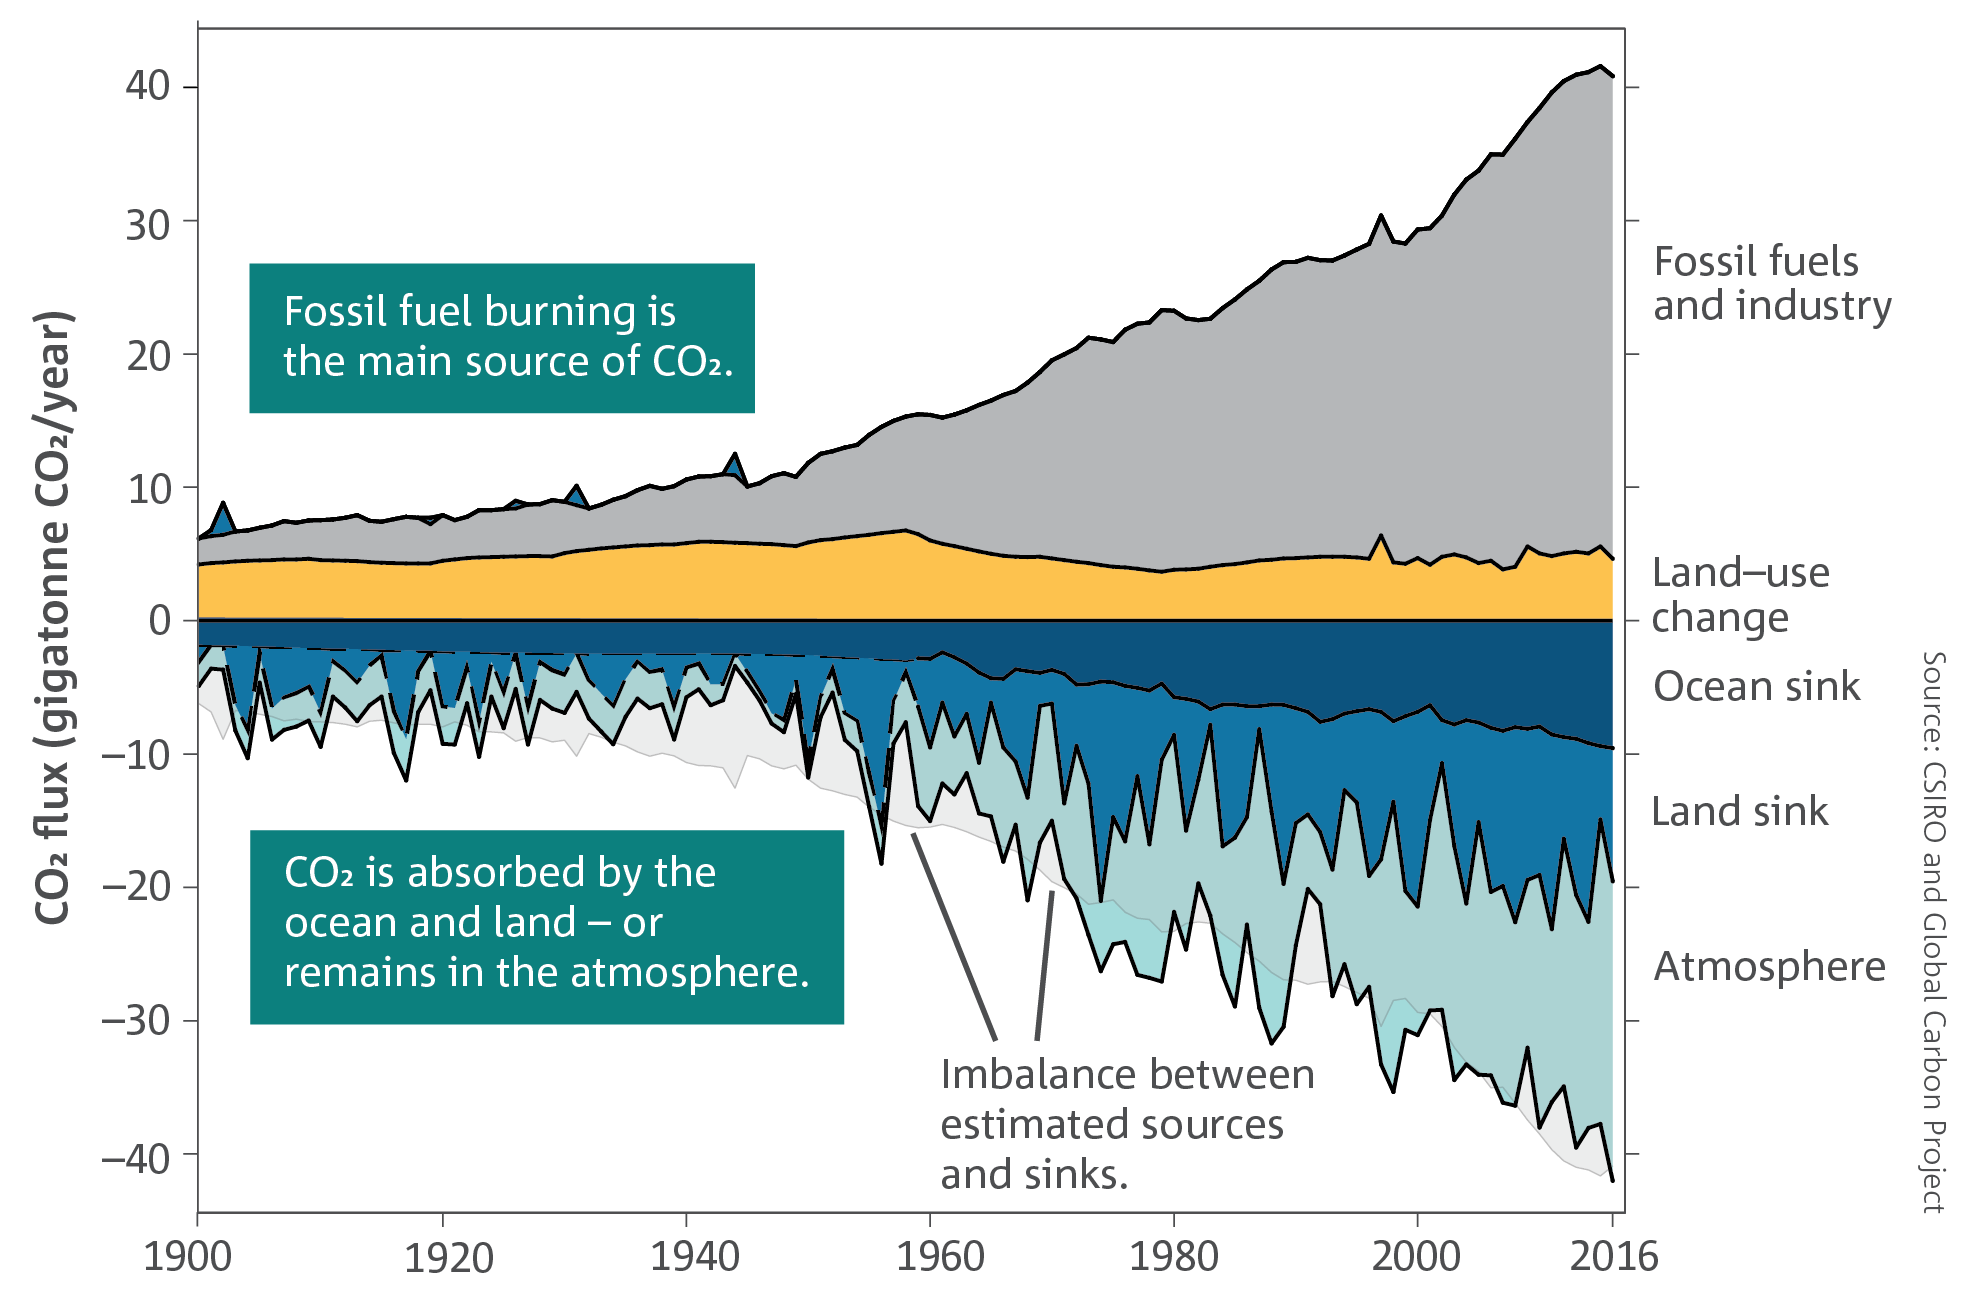
Analysis of the ratio of carbon types, or isotopes, in measured CO2 confirms that the observed increase in atmospheric CO2 is the result of CO2 emissions from human activities such as the combustion of fossil fuels and industrial processes, and changes in land use and land cover.
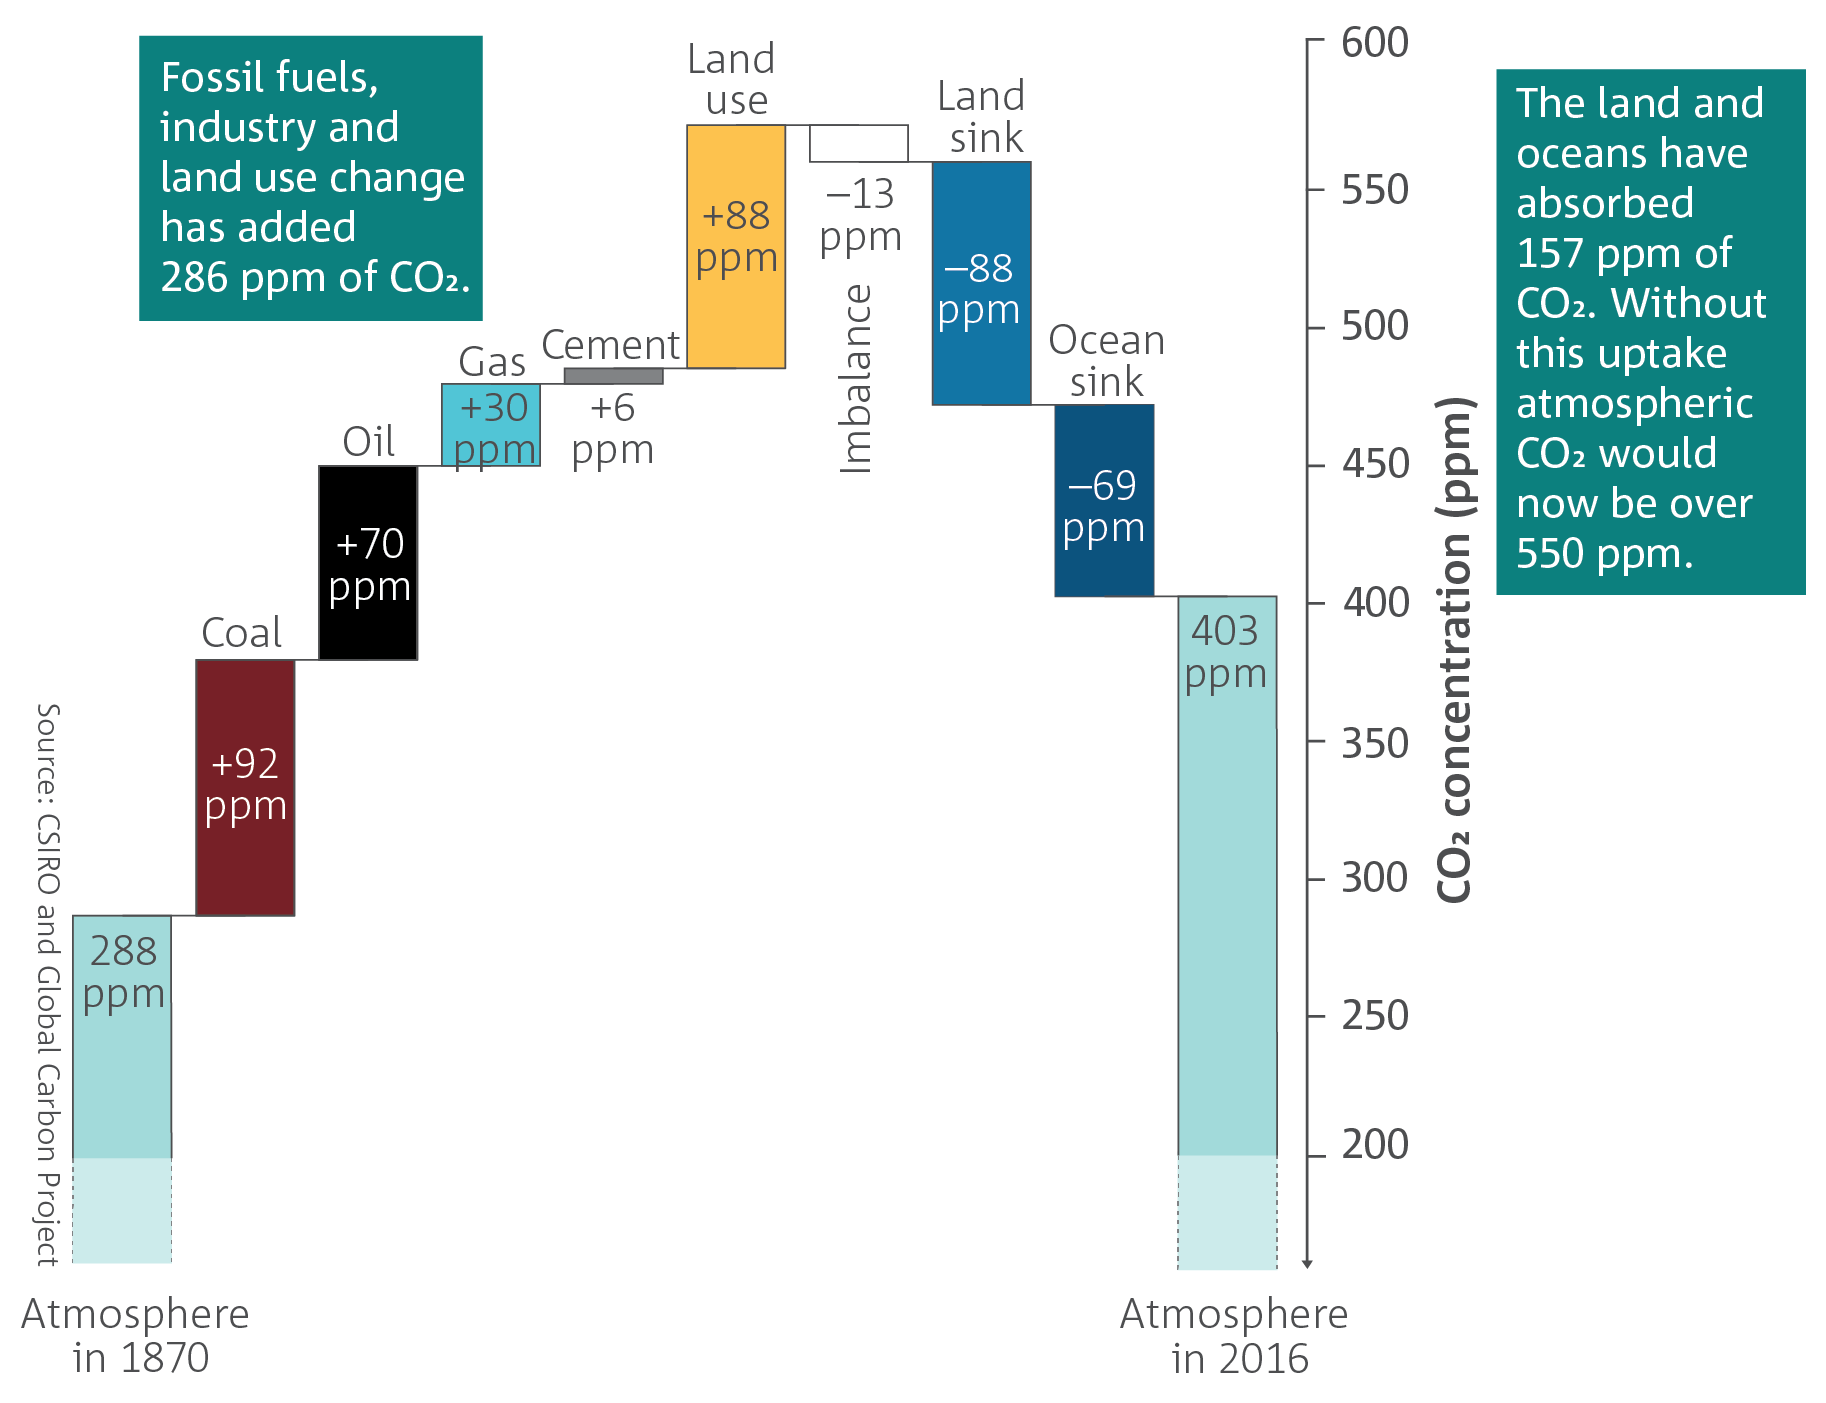
An analysis of the carbon sources and sinks shows that of the 600 ± 65 GtC (1 Gt = 1 billion tonnes = 1015 grams, 1 GtC = 3.664 GtCO2) of historical cumulative emissions from human activities during the industrial era, 420 ± 20 GtC were from the combustion of fossil fuels and 180 GtC from land-use change. Emissions from fossil fuels continue to increase, despite relatively little change during 2014–2016. Emissions from land-use change are complex to measure but are estimated to have been stable over the past decade. On the uptake side, about 25 per cent of the CO2 emissions from human activities have been taken up by the ocean through diffusion, and over 30 per cent by the vegetation on land, and the remaining emissions have remained in the atmosphere and led to the observed increase in the concentration of atmospheric CO2.
Greenhouse gases
- Global average concentrations of all the major long-lived greenhouse gases continue to rise in the atmosphere, with carbon dioxide concentrations rising above 400 ppm since 2016 and the CO2 equivalent of all gases reaching 500 ppm in 2017.
- Emissions from burning fossil fuels continue to increase and are the dominant contributor to the observed growth in atmospheric CO2.
The global annual mean CO2 level in 2017 was 405 ppm—a 46 per cent increase from the concentration of 278 ppm around the year 1750, and likely the highest level in at least the past two million years. Cape Grim, located at the northwest tip of Tasmania, is one of three key global greenhouse gas monitoring stations in the World Meteorological Organization’s Global Atmosphere Watch program, and has been running continuously for 42 years. Atmospheric concentration of CO2 measured at the Cape Grim Baseline Air Pollution Station shows a steady upward trend, passing 400 ppm in May 2016 and remaining above this level since. The annual average CO2 concentration at Cape Grim in 2017 was 402 ppm.
Globally averaged atmospheric concentrations of all major long-lived greenhouse gases, carbon dioxide (CO2), methane (CH4), nitrous oxide (N2O) and a group of synthetic greenhouse gases, continue to rise. The amounts of CO2, CH4 and N2O in the atmosphere show significant seasonal and year-to-year variabilities, but all show ongoing upward trends.
The impact of all the long-lived greenhouse gases in the atmosphere combined can be expressed as an enhancement of the net radiation, or ‘radiative forcing’, in watts per metre squared. CO2 is the largest contributor to this enhancement, but other gases make a significant contribution. The impact of all greenhouse gases can be converted to an ‘equivalent CO2 (CO2-e)’ atmospheric concentration. The global annual average CO2-e reached 501.5 ppm in 2017, and the CO2-e value at Cape Grim reached the 500 ppm milestone in mid-2018.
Measurements of air extracted from Antarctic ice extend the record of measured atmospheric CO2 concentrations to 800,000 years ago. Over the past 2000 years, concentrations were around 280 ppm with only small changes until the start of the industrial era, before rapidly increasing. Over the previous 800,000 years, CO2 concentrations varied between regular warm periods and colder glacial periods but were always lower than those of the past century. The last time atmospheric CO2 concentrations were the same or higher than present day was the Pliocene epoch, more than 2.3 million years ago, as determined from isotopes and organic molecule tracers in ocean sediments.
Analysis of the ratio of carbon types, or isotopes, in measured CO2 confirms that the observed increase in atmospheric CO2 is the result of CO2 emissions from human activities such as the combustion of fossil fuels and industrial processes, and changes in land use and land cover.
An analysis of the carbon sources and sinks shows that of the 600 ± 65 GtC (1 Gt = 1 billion tonnes = 1015 grams, 1 GtC = 3.664 GtCO2) of historical cumulative emissions from human activities during the industrial era, 420 ± 20 GtC were from the combustion of fossil fuels and 180 GtC from land-use change. Emissions from fossil fuels continue to increase, despite relatively little change during 2014–2016. Emissions from land-use change are complex to measure but are estimated to have been stable over the past decade. On the uptake side, about 25 per cent of the CO2 emissions from human activities have been taken up by the ocean through diffusion, and over 30 per cent by the vegetation on land, and the remaining emissions have remained in the atmosphere and led to the observed increase in the concentration of atmospheric CO2.