Temperature
- Australia’s climate has warmed on average by 1.44 ± 0.24 °C since national records began in 1910, leading to an increase in the frequency of extreme heat events.
Australia’s weather and climate are changing in response to a warming global climate. Australia has warmed on average by 1.44 ± 0.24 °C since national records began in 1910, with most warming occurring since 1950 and every decade since then being warmer than the ones before. Australia’s warmest year on record was 2019, and the seven years from 2013 to 2019 all rank in the nine warmest years. This long‑term warming trend means that most years are now warmer than almost any observed during the 20th century. When relatively cooler years do occur, it is because natural drivers that typically cool Australia’s climate, such as La Niña, act to partially offset the background warming trend.
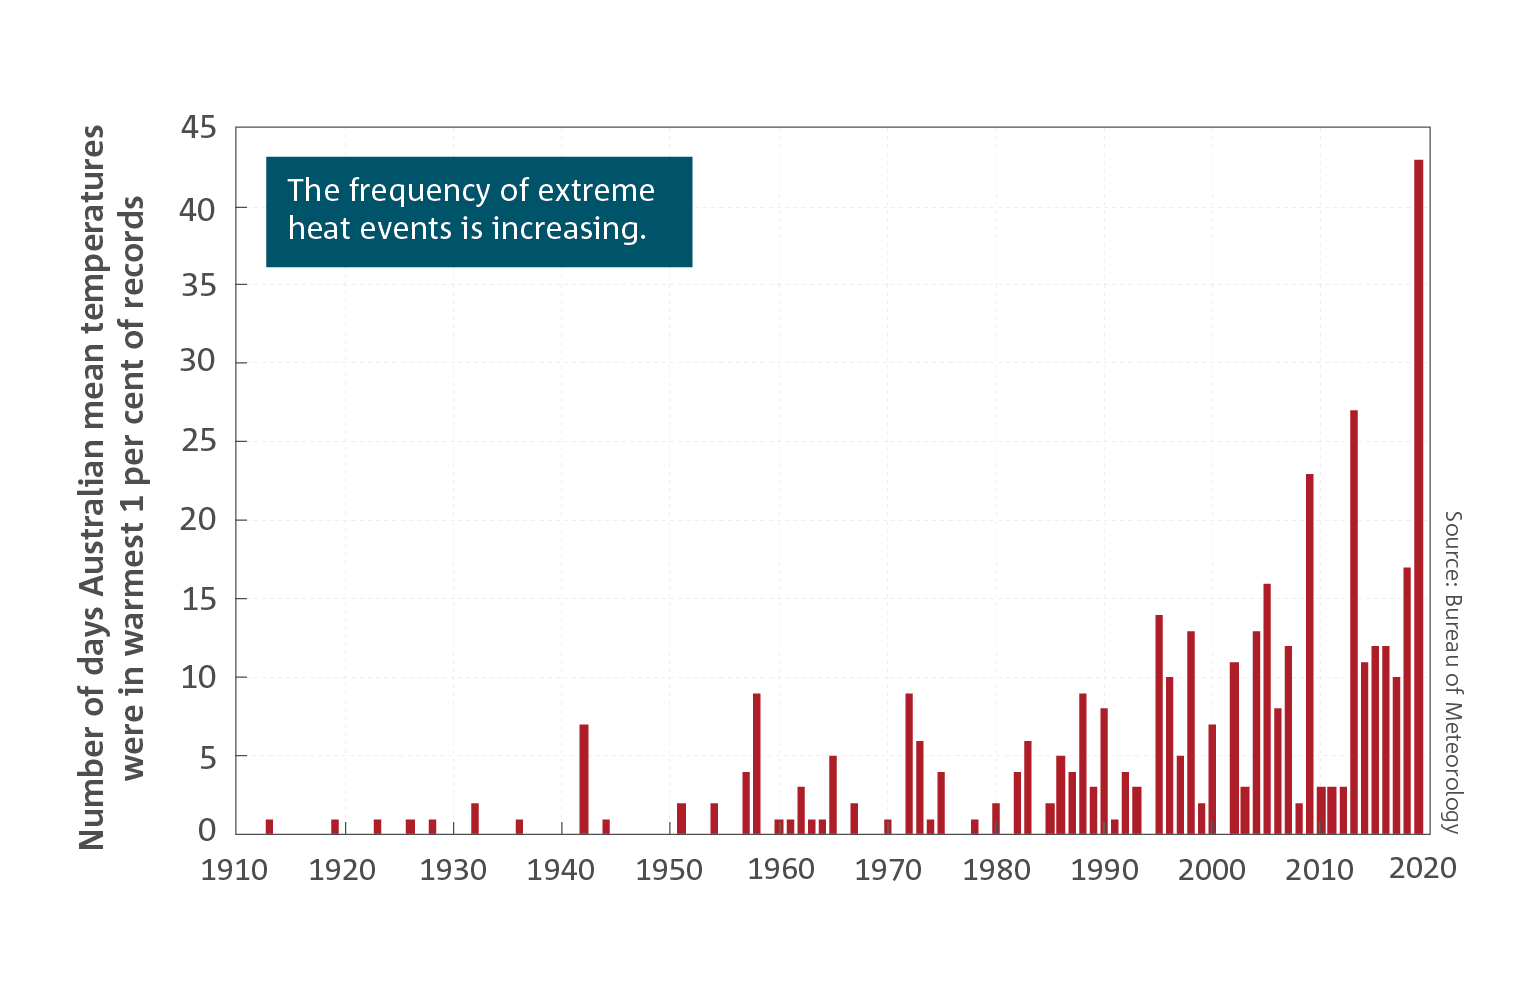 Warming is observed across Australia in all months with both day and night‑time temperatures increasing. This shift is accompanied by more extreme nationally averaged daily heat events across all months. For example, 2019 experienced 43 extremely warm days, more than triple the number in any of the years prior to 2000. This increasing trend is observed at locations across all of Australia.
In summer we now see a greater frequency of very hot days compared to earlier decades. In terms of national daily average maximum temperatures, there were 33 days that exceeded 39 °C in 2019, more than the number observed from 1960 to 2018 combined, which totalled 24 days.
Australia’s climate has warmed by over 1 °C since 1960, which has caused an increase in the frequency of months that are much warmer than usual. Very high monthly maximum temperatures that occurred nearly 2 per cent of the time in 1960–1989 and over 4 per cent of the time in 1990–2004, now occur over 12 per cent of the time (2005–2019). This is more than a sixfold increase over the sixty-year period. Very warm monthly night-time temperatures that occurred nearly 2 per cent of the time in 1960–1989 and over 5 per cent of the time in 1990–2004, now occur around 11 per cent of the time (2005–2019).
This shift in extremes has many impacts on human health, ecosystems and infrastructure and informs climate impact and risk assessments.
The frequency of extremely cold days and nights has declined across Australia. An exception to this is for extremely cold nights in those parts of southeast and southwest Australia which have seen significant cool season drying, and hence more clear winter nights. The frequency of frost in these parts is relatively unchanged since the 1980s.
Fire weather
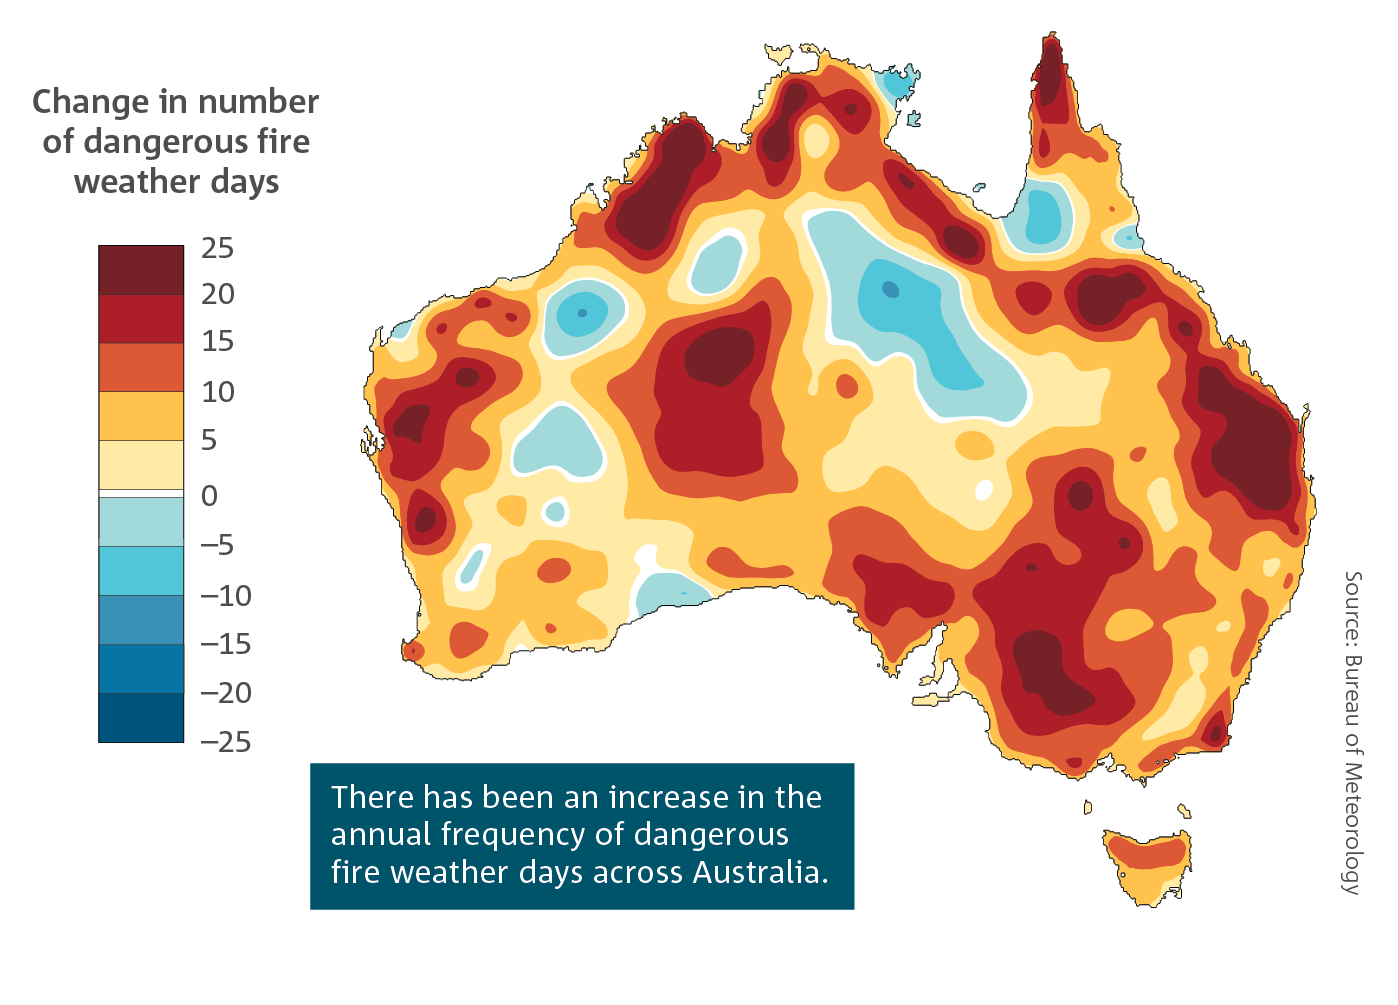
- There has been an increase in extreme fire weather, and in the length of the fire season, across large parts of Australia since the 1950s, especially in southern Australia.
Fire weather is largely monitored in Australia using the Forest Fire Danger Index (FFDI). The FFDI indicates the fire danger on a given day based on observations of temperature, rainfall, humidity and wind speed. The frequency of the most dangerous 10 per cent of fireweather days has increased significantly in recent decades across many regions of Australia, especially in the south and east. These increases are particularly evident during spring and summer and are associated with an earlier start to the southern fire weather season.
 Climate change is contributing to these changes in fire weather including by affecting temperature, relative humidity and associated changes to the fuel moisture content. Considerable year‑to-year variability in fire weather also occurs. La Niña years, for example 2010–11 and 1999–2000, are associated with wet and cool climate anomalies and a lower number of days with high FFDI values.
Dry lightning that occurs without significant rainfall is the primary source of natural ignition for bushfires. Understanding changes to bushfire ignition in Australia is a current area of active research, including the frequency of dry lightning.
There is a significant trend in some regions of southern Australia towards more days with weather conditions conducive to extreme bushfires that can generate thunderstorms within their smoke plumes. These fire-generated thunderstorms can lead to extremely dangerous fire conditions, as observed during the 2019–20 summer, and for the Canberra (2003) and Victorian Black Saturday (2009) fires. In some cases, the lightning strikes produced from the smoke plumes generate new fires.
Climate change influences long-term trends in some of the key risk factors for bushfires in Australia. While the influence of climate change on long‑term trends is clear, the attribution of a single fire event to climate change is difficult and is the subject of current research. Climate change affects the dryness and amount of fuel, through changes in rainfall and air temperature and atmospheric moisture content that exacerbate landscape drying. Furthermore, increased CO2 can also alter the rate and amount of plant growth, which may also affect the fuel load. Increased frequency and intensity of extreme heat as a result of climate change can also worsen extreme fire weather risk.
Rainfall
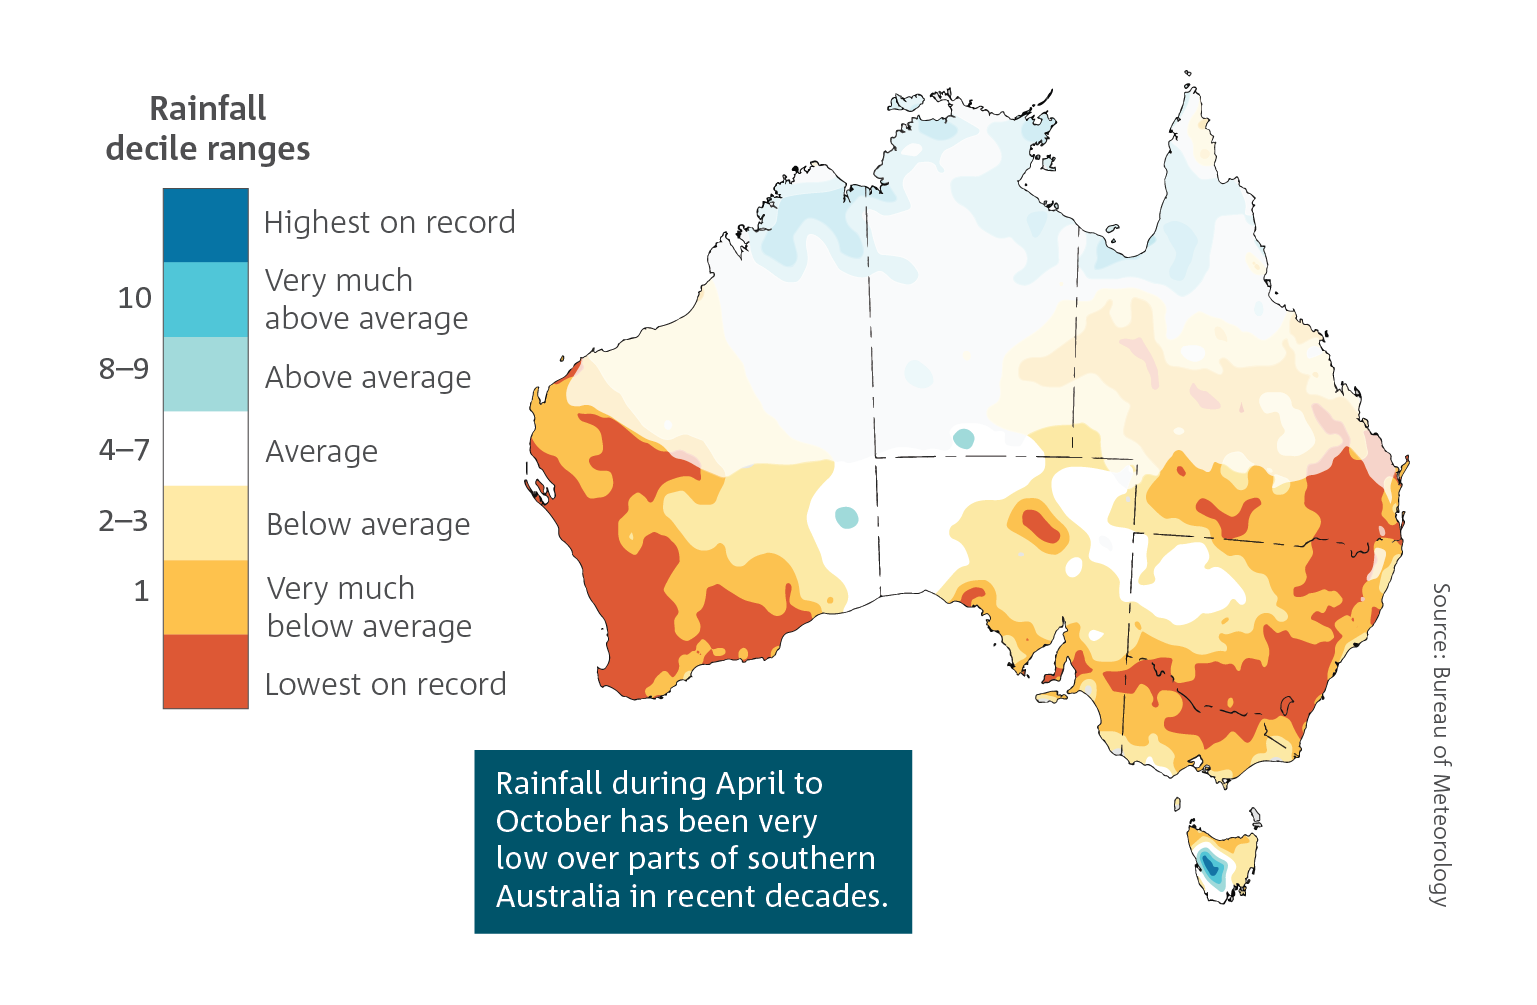
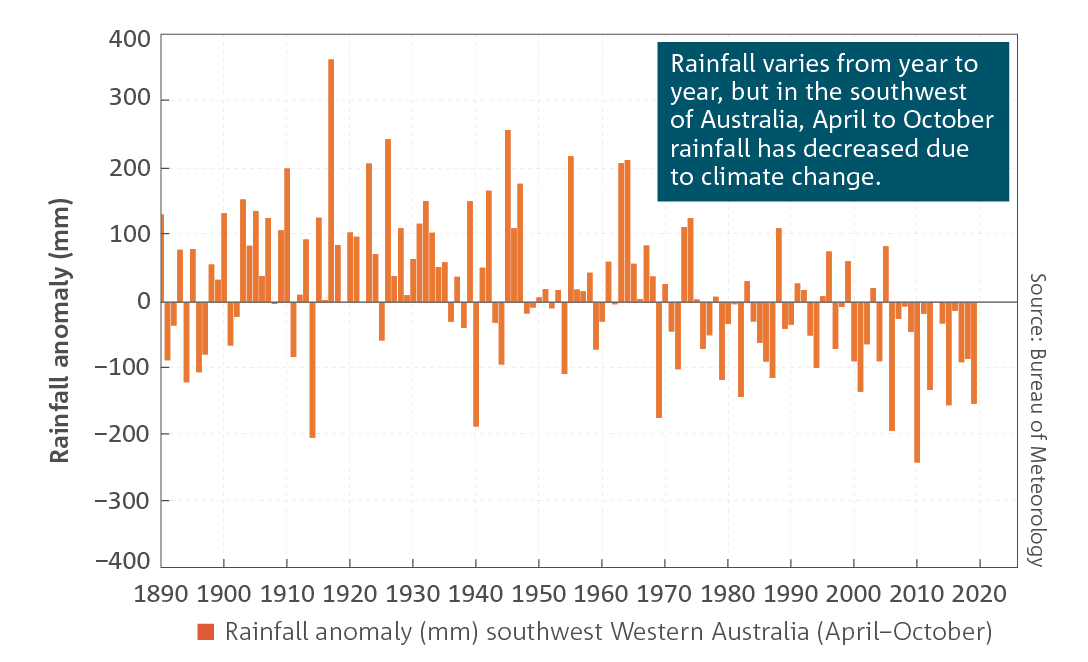
- There has been a decline of around 16 per cent in April to October rainfall in the southwest of Australia since 1970. Across the same region May to July rainfall has seen the largest decrease, by around 20 per cent since 1970.
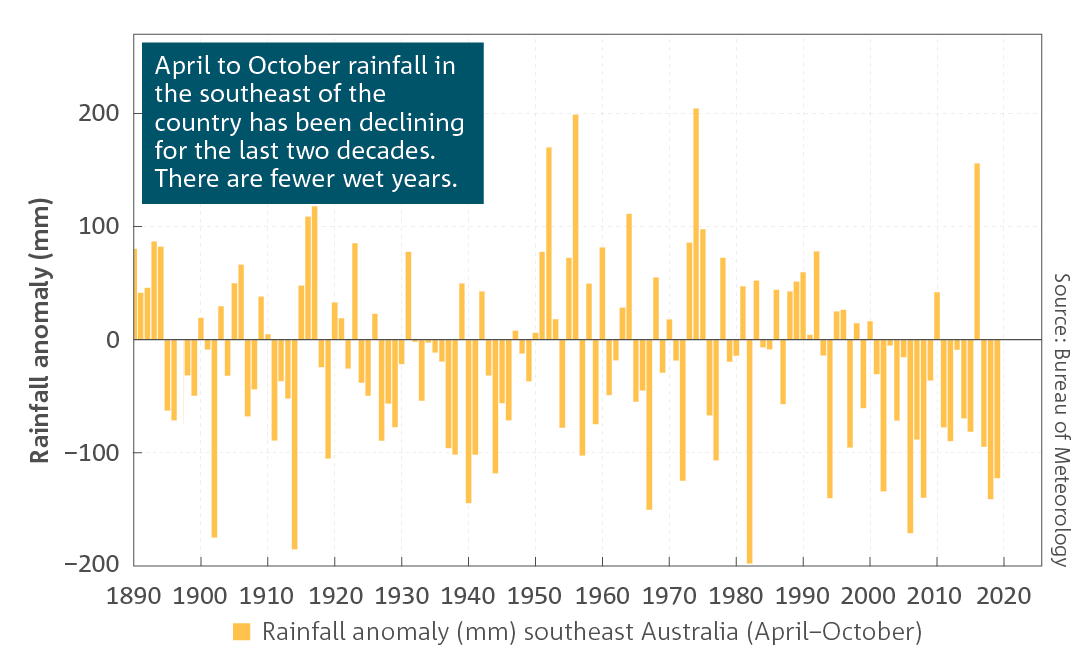
- In the southeast of Australia there has been a decline of around 12 per cent in April to October rainfall since the late 1990s.
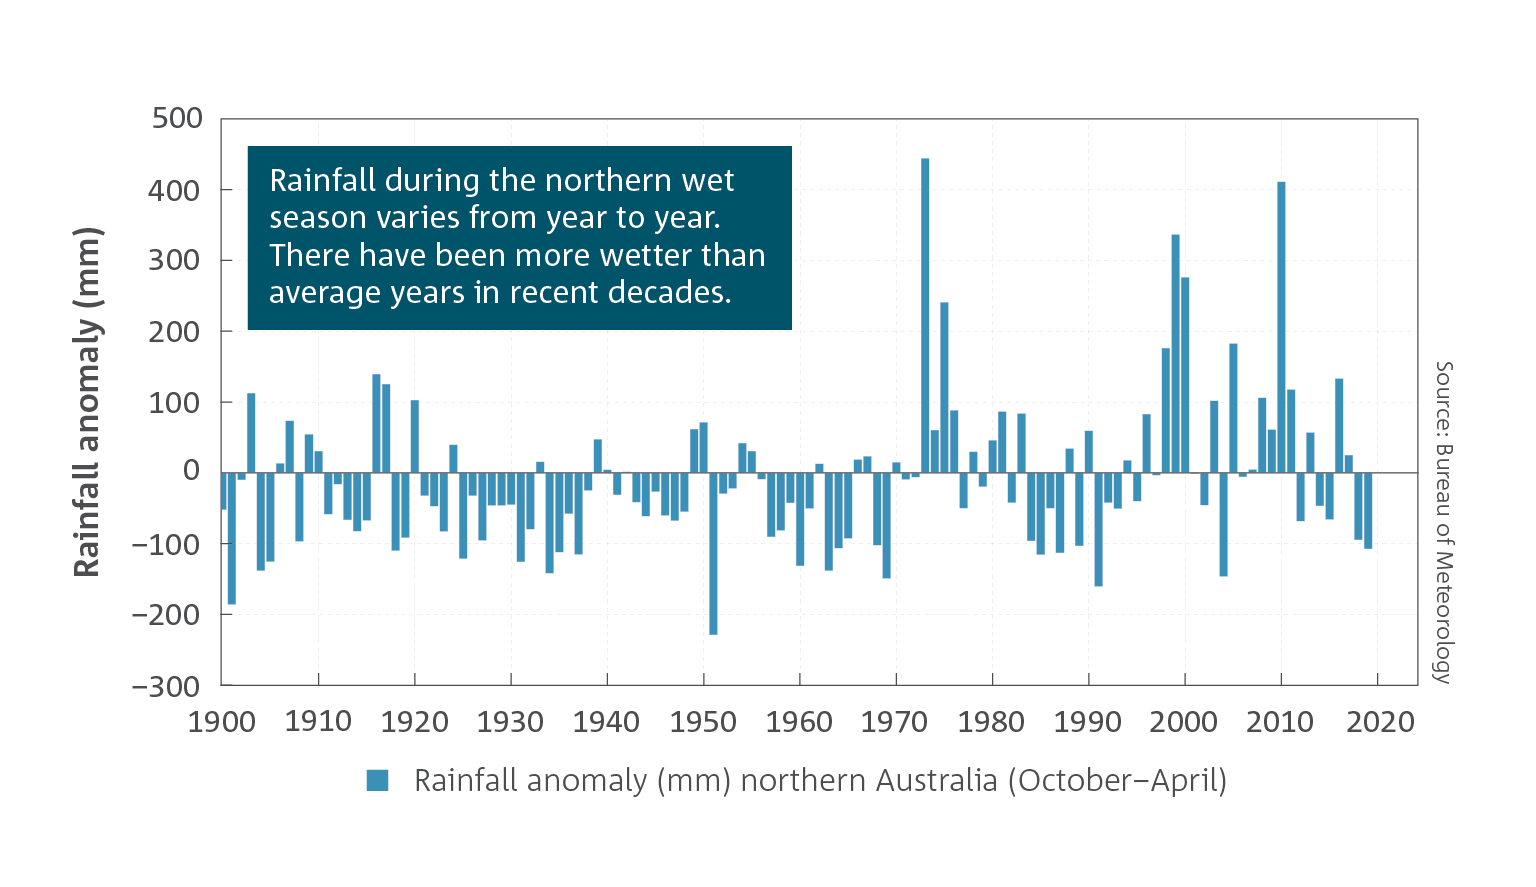
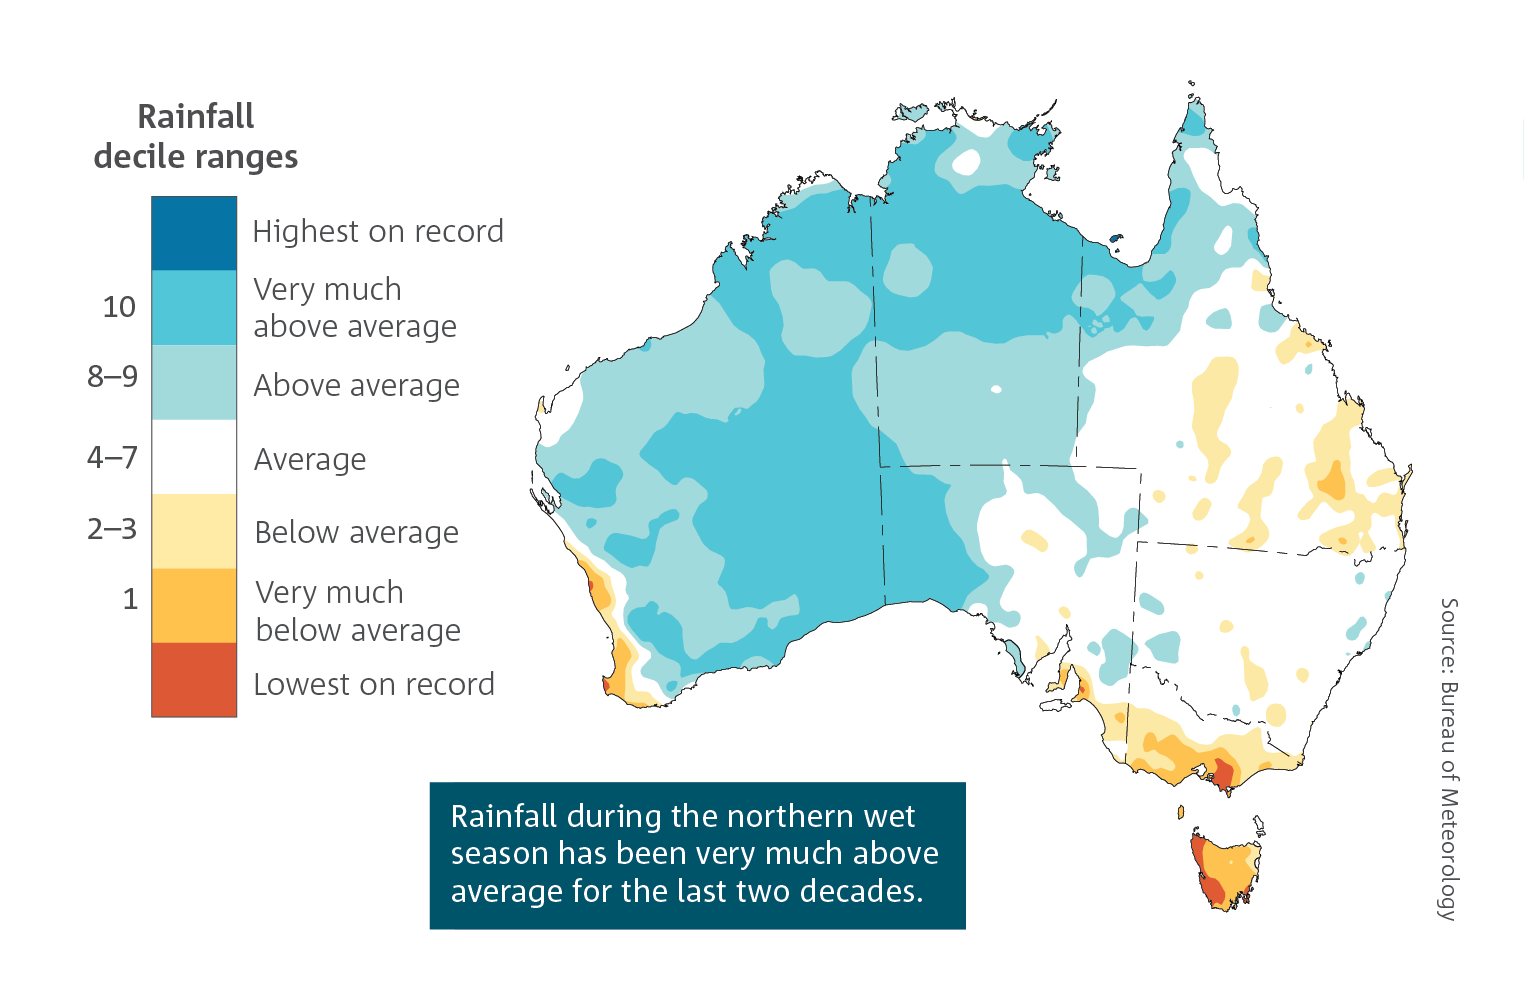
- Rainfall has increased across most of northern Australia since the 1970s.
Australian rainfall is highly variable and is strongly influenced by drivers such as El Niño, La Niña, the Indian Ocean Dipole and the Southern Annular Mode. Despite this natural variability, long‑term trends are evident in Australia’s rainfall record. There has been a shift towards drier conditions across the southwest and southeast, with more frequent years of below average rainfall, especially for the cool season months of April to October. In 17 of the last 20 years, rainfall in southern Australia in these months has been below average. This is due to a combination of natural variability on decadal timescales and changes in large‑scale circulation caused by increased anthropogenic greenhouse gas emissions.
Recent years with above-average rainfall in southern Australia were generally associated with drivers of higher than usual rainfall, such as a strong negative Indian Ocean Dipole in 2016, and La Niña in 2010–11. In contrast to southern mainland Australia, cool season rainfall has been above average in western Tasmania during recent decades.
The drying trend in southern Australia has been most evident in the southwest and southeast of the country. Rainfall analyses in these regions can be extended back to around 1890 due to greater data coverage, enabling current droughts to be compared to historical droughts such as the Federation drought (1895 to 1902). The recent drying across these regions is the most sustained large-scale change in observed rainfall since the late 1880s. The trend is particularly strong for the period from May to July over southwest Western Australia, with rainfall since 1970 around 20 per cent less than the average from 1900 to 1969. Since 2000, this decline has increased to around 28 per cent. For the southeast of the continent, April to October rainfall for the period 2000 to 2019 has decreased by around 12 per cent when compared to 1900–1999. This period encompasses most of the Millennium drought, which saw low annual rainfall totals across the region from 1997 to 2009. However, cool season rainfall totals are still around 10 per cent below the 1900–1999 average in the years since the Millennium drought.
The cooler months between April and October are important hydrologically across southern Australia. The declining trend in rainfall during this period is associated with a trend towards higher surface pressure in the region and a shift in large-scale weather patterns—more highs and fewer lows. This increase in surface pressure across southern latitudes is a known response to climate change. There has been a reduction in the number of cold fronts and lows that produce rainfall in both southwest and southeast Australia, which are the most important weather systems for rainfall in these areas during the cool half of the year.
In contrast, northern Australia has been wetter across all seasons, but especially in the northwest during the northern wet season (October to April). However, rainfall variability remains high, with, for example, below average rainfall totals in northern Australia during both the 2018–19 and 2019–20 wet seasons.
Heavy rainfall
- Heavy rainfall events are becoming more intense.
Observations show that there has been an increase in the intensity of heavy rainfall events in Australia. The intensity of short-duration (hourly) extreme rainfall events has increased by around 10 per cent or more in some regions and in recent decades, with larger increases typically observed in the north of the country. Short-duration extreme rainfall events are often associated with flash flooding, and so these changes in intensity bring increased risk to communities. This is particularly so in urban environments where the large amount of impervious ground cover (e.g. concrete) leads to increased flooding during heavy downpours.
Heavy rainfall events are typically caused by weather systems such as thunderstorms, cyclones and east coast lows. Daily rainfall totals associated with thunderstorms have increased since 1979, particularly in northern Australia. This is due to an increase in the intensity of rainfall per storm, rather than an increase in the number of storms in general.
At the same time, the number of low-pressure systems that can bring heavy rainfall to heavily populated parts of southern Australia have declined in recent decades. This could have implications for recharging water storages and water resource management.
As the climate warms, heavy rainfall events are expected to continue to become more intense. A warmer atmosphere can hold more water vapour than a cooler atmosphere, and this relationship alone can increase moisture in the atmosphere by 7 per cent per degree of global warming. This can cause an increased likelihood of heavy rainfall events. Increased atmospheric moisture can also provide more energy for some processes that generate extreme rainfall events, which further increases the likelihood of heavy rainfall due to global warming.
Compound extreme events
Climate change influences the frequency, magnitude and impacts of many types of extreme weather and climate events. When extreme weather and climate events occur consecutively within a short timeframe of each other, or when multiple types of extreme events coincide, the impacts can compound in severity. For example, heatwaves can have a larger impact when combined with the stress of long‑term drought.
Extreme events are more likely when natural climate variability acts to amplify the background influence of climate change. For example, record-breaking extreme heat and record-breaking fire weather are more likely when the El Niño–Southern Oscillation or the Indian Ocean Dipole favour warmer and drier conditions in Australia, since this reinforces warming and drying trends.
The spring and early summer of 2019 provides a good example of compounding extreme weather and climate conditions and illustrates the effect of background climate trends amplifying natural climate variability. In this period record-breaking low rainfall coincided with extreme heat, and both continued into early 2020. An extreme positive Indian Ocean Dipole and rare Antarctic stratospheric warming in 2019 provided the naturally occurring climate variability that exacerbated long-term climate trends. These combined influences led to severe drought, record-breaking heatwaves and fire weather.
Natural climate variability, which affects Australia’s climate from one year to the next, means that not every year will see weather and climate that was as extreme as in 2019. However, the warming trend, primarily caused by climate change, increases the likelihood of extreme events that are beyond our historical experience. Multiple lines of evidence, including from observations and future climate change projections, point to a continuing trend of more frequent compound extreme events. Projecting the occurrence and severity of extreme events is therefore essential for current and future risk assessments, and for climate adaptation strategies and responses.
Streamflow
- Three quarters of hydrologic reference stations around Australia show a declining trend in streamflow.
The observed long-term reduction in rainfall across many parts of southern Australia has led to reduced streamflow. Declines in annual median streamflow have been observed in the Murray–Darling Basin, the South West Coast, the South Australian Gulf, the South East Coast (Victoria) and the South
East Coast (New South Wales) drainage divisions. In each of these, between half and three quarters of gauges show a declining streamflow trend since 1975.
In the Tanami–Timor Sea Coast drainage division in northern Australia, which includes Darwin and much of the Northern Territory, there is an increasing trend in annual median flows at about 67 per cent of the gauges since 1975.
This is consistent with the observed increase in rainfall since the 1970s in the region. In the Murray–Darling Basin, more than three quarters of the long-term streamflow gauges show a declining trend since records began in 1970. This is more severe in the northern Basin where 94 per cent of the gauges show a declining trend in streamflow. In the northern Basin catchments, where these trends are strongly evident, there are statistically significant declining trends in the headwaters, including the Namoi, Condamine–Culgoa and Gwydir River catchments. In the Murrumbidgee, Lachlan, Goulburn and Loddon River catchments of the southern Basin, more than three quarters of the streamflow gauges show declining trends; these trends are statistically significant in one third of these gauging stations. In the Darling River region, declining trends were observed in all 19 streamflow gauges, of which half show a statistically significant declining trend.
Three quarters of Australia’s hydrologic reference stations show a declining trend in streamflow, with a quarter of these showing a statistically significant declining trend. Hydrologic reference stations are an indicator of long‑term impacts from climate change on streamflow, as they are gauges in catchments with little disturbance from human activities and with at least a 30‑year record.
Tropical cyclones
- There has been a decrease in the number of tropical cyclones observed in the Australian region since 1982.
Tropical cyclone activity in Australia’s cyclone region varies substantially from year to year. This is partially due to the influence of large-scale climate drivers; the number of cyclones in our region generally declines with El Niño and increases with La Niña.
There has been a downward trend in the number of tropical cyclones observed in the Australian region since 1982. The trend in cyclone intensity is harder to quantify or estimate.
Snowfall
- A downward trend in maximum snow depth has been observed for Australian alpine regions since the late 1950s, with large year-to-year variability.
Downward trends in maximum snow depth have been observed for Australian alpine regions since the late 1950s, with the largest declines during spring and at lower altitudes. Downward trends in the temporal and spatial extent of snow cover and the number of snowfall days are also observed.
Snow depth is closely related to temperature, and the observed declines are associated with the observed warming trends. Maximum snow depth remains highly variable and is strongly influenced by rare heavy snowfall days, which have no observed trends in frequency. Several heavy snowfall events contributed to average to high maximum snow depths in the seasons from 2017 to 2019.
Temperature
- Australia’s climate has warmed on average by 1.44 ± 0.24 °C since national records began in 1910, leading to an increase in the frequency of extreme heat events.
Australia’s weather and climate are changing in response to a warming global climate. Australia has warmed on average by 1.44 ± 0.24 °C since national records began in 1910, with most warming occurring since 1950 and every decade since then being warmer than the ones before. Australia’s warmest year on record was 2019, and the seven years from 2013 to 2019 all rank in the nine warmest years. This long‑term warming trend means that most years are now warmer than almost any observed during the 20th century. When relatively cooler years do occur, it is because natural drivers that typically cool Australia’s climate, such as La Niña, act to partially offset the background warming trend.
Warming is observed across Australia in all months with both day and night‑time temperatures increasing. This shift is accompanied by more extreme nationally averaged daily heat events across all months. For example, 2019 experienced 43 extremely warm days, more than triple the number in any of the years prior to 2000. This increasing trend is observed at locations across all of Australia.
In summer we now see a greater frequency of very hot days compared to earlier decades. In terms of national daily average maximum temperatures, there were 33 days that exceeded 39 °C in 2019, more than the number observed from 1960 to 2018 combined, which totalled 24 days.
Australia’s climate has warmed by over 1 °C since 1960, which has caused an increase in the frequency of months that are much warmer than usual. Very high monthly maximum temperatures that occurred nearly 2 per cent of the time in 1960–1989 and over 4 per cent of the time in 1990–2004, now occur over 12 per cent of the time (2005–2019). This is more than a sixfold increase over the sixty-year period. Very warm monthly night-time temperatures that occurred nearly 2 per cent of the time in 1960–1989 and over 5 per cent of the time in 1990–2004, now occur around 11 per cent of the time (2005–2019).
This shift in extremes has many impacts on human health, ecosystems and infrastructure and informs climate impact and risk assessments.
The frequency of extremely cold days and nights has declined across Australia. An exception to this is for extremely cold nights in those parts of southeast and southwest Australia which have seen significant cool season drying, and hence more clear winter nights. The frequency of frost in these parts is relatively unchanged since the 1980s.
Fire weather
- There has been an increase in extreme fire weather, and in the length of the fire season, across large parts of Australia since the 1950s, especially in southern Australia.
Fire weather is largely monitored in Australia using the Forest Fire Danger Index (FFDI). The FFDI indicates the fire danger on a given day based on observations of temperature, rainfall, humidity and wind speed. The frequency of the most dangerous 10 per cent of fireweather days has increased significantly in recent decades across many regions of Australia, especially in the south and east. These increases are particularly evident during spring and summer and are associated with an earlier start to the southern fire weather season.
Climate change is contributing to these changes in fire weather including by affecting temperature, relative humidity and associated changes to the fuel moisture content. Considerable year‑to-year variability in fire weather also occurs. La Niña years, for example 2010–11 and 1999–2000, are associated with wet and cool climate anomalies and a lower number of days with high FFDI values.
Dry lightning that occurs without significant rainfall is the primary source of natural ignition for bushfires. Understanding changes to bushfire ignition in Australia is a current area of active research, including the frequency of dry lightning.
There is a significant trend in some regions of southern Australia towards more days with weather conditions conducive to extreme bushfires that can generate thunderstorms within their smoke plumes. These fire-generated thunderstorms can lead to extremely dangerous fire conditions, as observed during the 2019–20 summer, and for the Canberra (2003) and Victorian Black Saturday (2009) fires. In some cases, the lightning strikes produced from the smoke plumes generate new fires.
Climate change influences long-term trends in some of the key risk factors for bushfires in Australia. While the influence of climate change on long‑term trends is clear, the attribution of a single fire event to climate change is difficult and is the subject of current research. Climate change affects the dryness and amount of fuel, through changes in rainfall and air temperature and atmospheric moisture content that exacerbate landscape drying. Furthermore, increased CO2 can also alter the rate and amount of plant growth, which may also affect the fuel load. Increased frequency and intensity of extreme heat as a result of climate change can also worsen extreme fire weather risk.
Rainfall
- There has been a decline of around 16 per cent in April to October rainfall in the southwest of Australia since 1970. Across the same region May to July rainfall has seen the largest decrease, by around 20 per cent since 1970.
- In the southeast of Australia there has been a decline of around 12 per cent in April to October rainfall since the late 1990s.
- Rainfall has increased across most of northern Australia since the 1970s.
Australian rainfall is highly variable and is strongly influenced by drivers such as El Niño, La Niña, the Indian Ocean Dipole and the Southern Annular Mode. Despite this natural variability, long‑term trends are evident in Australia’s rainfall record. There has been a shift towards drier conditions across the southwest and southeast, with more frequent years of below average rainfall, especially for the cool season months of April to October. In 17 of the last 20 years, rainfall in southern Australia in these months has been below average. This is due to a combination of natural variability on decadal timescales and changes in large‑scale circulation caused by increased anthropogenic greenhouse gas emissions.
Recent years with above-average rainfall in southern Australia were generally associated with drivers of higher than usual rainfall, such as a strong negative Indian Ocean Dipole in 2016, and La Niña in 2010–11. In contrast to southern mainland Australia, cool season rainfall has been above average in western Tasmania during recent decades.
The drying trend in southern Australia has been most evident in the southwest and southeast of the country. Rainfall analyses in these regions can be extended back to around 1890 due to greater data coverage, enabling current droughts to be compared to historical droughts such as the Federation drought (1895 to 1902). The recent drying across these regions is the most sustained large-scale change in observed rainfall since the late 1880s. The trend is particularly strong for the period from May to July over southwest Western Australia, with rainfall since 1970 around 20 per cent less than the average from 1900 to 1969. Since 2000, this decline has increased to around 28 per cent. For the southeast of the continent, April to October rainfall for the period 2000 to 2019 has decreased by around 12 per cent when compared to 1900–1999. This period encompasses most of the Millennium drought, which saw low annual rainfall totals across the region from 1997 to 2009. However, cool season rainfall totals are still around 10 per cent below the 1900–1999 average in the years since the Millennium drought.
The cooler months between April and October are important hydrologically across southern Australia. The declining trend in rainfall during this period is associated with a trend towards higher surface pressure in the region and a shift in large-scale weather patterns—more highs and fewer lows. This increase in surface pressure across southern latitudes is a known response to climate change. There has been a reduction in the number of cold fronts and lows that produce rainfall in both southwest and southeast Australia, which are the most important weather systems for rainfall in these areas during the cool half of the year.
In contrast, northern Australia has been wetter across all seasons, but especially in the northwest during the northern wet season (October to April). However, rainfall variability remains high, with, for example, below average rainfall totals in northern Australia during both the 2018–19 and 2019–20 wet seasons.
Heavy rainfall
- Heavy rainfall events are becoming more intense.
Observations show that there has been an increase in the intensity of heavy rainfall events in Australia. The intensity of short-duration (hourly) extreme rainfall events has increased by around 10 per cent or more in some regions and in recent decades, with larger increases typically observed in the north of the country. Short-duration extreme rainfall events are often associated with flash flooding, and so these changes in intensity bring increased risk to communities. This is particularly so in urban environments where the large amount of impervious ground cover (e.g. concrete) leads to increased flooding during heavy downpours.
Heavy rainfall events are typically caused by weather systems such as thunderstorms, cyclones and east coast lows. Daily rainfall totals associated with thunderstorms have increased since 1979, particularly in northern Australia. This is due to an increase in the intensity of rainfall per storm, rather than an increase in the number of storms in general.
At the same time, the number of low-pressure systems that can bring heavy rainfall to heavily populated parts of southern Australia have declined in recent decades. This could have implications for recharging water storages and water resource management.
As the climate warms, heavy rainfall events are expected to continue to become more intense. A warmer atmosphere can hold more water vapour than a cooler atmosphere, and this relationship alone can increase moisture in the atmosphere by 7 per cent per degree of global warming. This can cause an increased likelihood of heavy rainfall events. Increased atmospheric moisture can also provide more energy for some processes that generate extreme rainfall events, which further increases the likelihood of heavy rainfall due to global warming.
Compound extreme events
Climate change influences the frequency, magnitude and impacts of many types of extreme weather and climate events. When extreme weather and climate events occur consecutively within a short timeframe of each other, or when multiple types of extreme events coincide, the impacts can compound in severity. For example, heatwaves can have a larger impact when combined with the stress of long‑term drought.
Extreme events are more likely when natural climate variability acts to amplify the background influence of climate change. For example, record-breaking extreme heat and record-breaking fire weather are more likely when the El Niño–Southern Oscillation or the Indian Ocean Dipole favour warmer and drier conditions in Australia, since this reinforces warming and drying trends.
The spring and early summer of 2019 provides a good example of compounding extreme weather and climate conditions and illustrates the effect of background climate trends amplifying natural climate variability. In this period record-breaking low rainfall coincided with extreme heat, and both continued into early 2020. An extreme positive Indian Ocean Dipole and rare Antarctic stratospheric warming in 2019 provided the naturally occurring climate variability that exacerbated long-term climate trends. These combined influences led to severe drought, record-breaking heatwaves and fire weather.
Natural climate variability, which affects Australia’s climate from one year to the next, means that not every year will see weather and climate that was as extreme as in 2019. However, the warming trend, primarily caused by climate change, increases the likelihood of extreme events that are beyond our historical experience. Multiple lines of evidence, including from observations and future climate change projections, point to a continuing trend of more frequent compound extreme events. Projecting the occurrence and severity of extreme events is therefore essential for current and future risk assessments, and for climate adaptation strategies and responses.
Streamflow
- Three quarters of hydrologic reference stations around Australia show a declining trend in streamflow.
The observed long-term reduction in rainfall across many parts of southern Australia has led to reduced streamflow. Declines in annual median streamflow have been observed in the Murray–Darling Basin, the South West Coast, the South Australian Gulf, the South East Coast (Victoria) and the South
East Coast (New South Wales) drainage divisions. In each of these, between half and three quarters of gauges show a declining streamflow trend since 1975.
In the Tanami–Timor Sea Coast drainage division in northern Australia, which includes Darwin and much of the Northern Territory, there is an increasing trend in annual median flows at about 67 per cent of the gauges since 1975.
This is consistent with the observed increase in rainfall since the 1970s in the region. In the Murray–Darling Basin, more than three quarters of the long-term streamflow gauges show a declining trend since records began in 1970. This is more severe in the northern Basin where 94 per cent of the gauges show a declining trend in streamflow. In the northern Basin catchments, where these trends are strongly evident, there are statistically significant declining trends in the headwaters, including the Namoi, Condamine–Culgoa and Gwydir River catchments. In the Murrumbidgee, Lachlan, Goulburn and Loddon River catchments of the southern Basin, more than three quarters of the streamflow gauges show declining trends; these trends are statistically significant in one third of these gauging stations. In the Darling River region, declining trends were observed in all 19 streamflow gauges, of which half show a statistically significant declining trend.
Three quarters of Australia’s hydrologic reference stations show a declining trend in streamflow, with a quarter of these showing a statistically significant declining trend. Hydrologic reference stations are an indicator of long‑term impacts from climate change on streamflow, as they are gauges in catchments with little disturbance from human activities and with at least a 30‑year record.
Tropical cyclones
- There has been a decrease in the number of tropical cyclones observed in the Australian region since 1982.
Tropical cyclone activity in Australia’s cyclone region varies substantially from year to year. This is partially due to the influence of large-scale climate drivers; the number of cyclones in our region generally declines with El Niño and increases with La Niña.
There has been a downward trend in the number of tropical cyclones observed in the Australian region since 1982. The trend in cyclone intensity is harder to quantify or estimate.
Snowfall
- A downward trend in maximum snow depth has been observed for Australian alpine regions since the late 1950s, with large year-to-year variability.
Downward trends in maximum snow depth have been observed for Australian alpine regions since the late 1950s, with the largest declines during spring and at lower altitudes. Downward trends in the temporal and spatial extent of snow cover and the number of snowfall days are also observed.
Snow depth is closely related to temperature, and the observed declines are associated with the observed warming trends. Maximum snow depth remains highly variable and is strongly influenced by rare heavy snowfall days, which have no observed trends in frequency. Several heavy snowfall events contributed to average to high maximum snow depths in the seasons from 2017 to 2019.