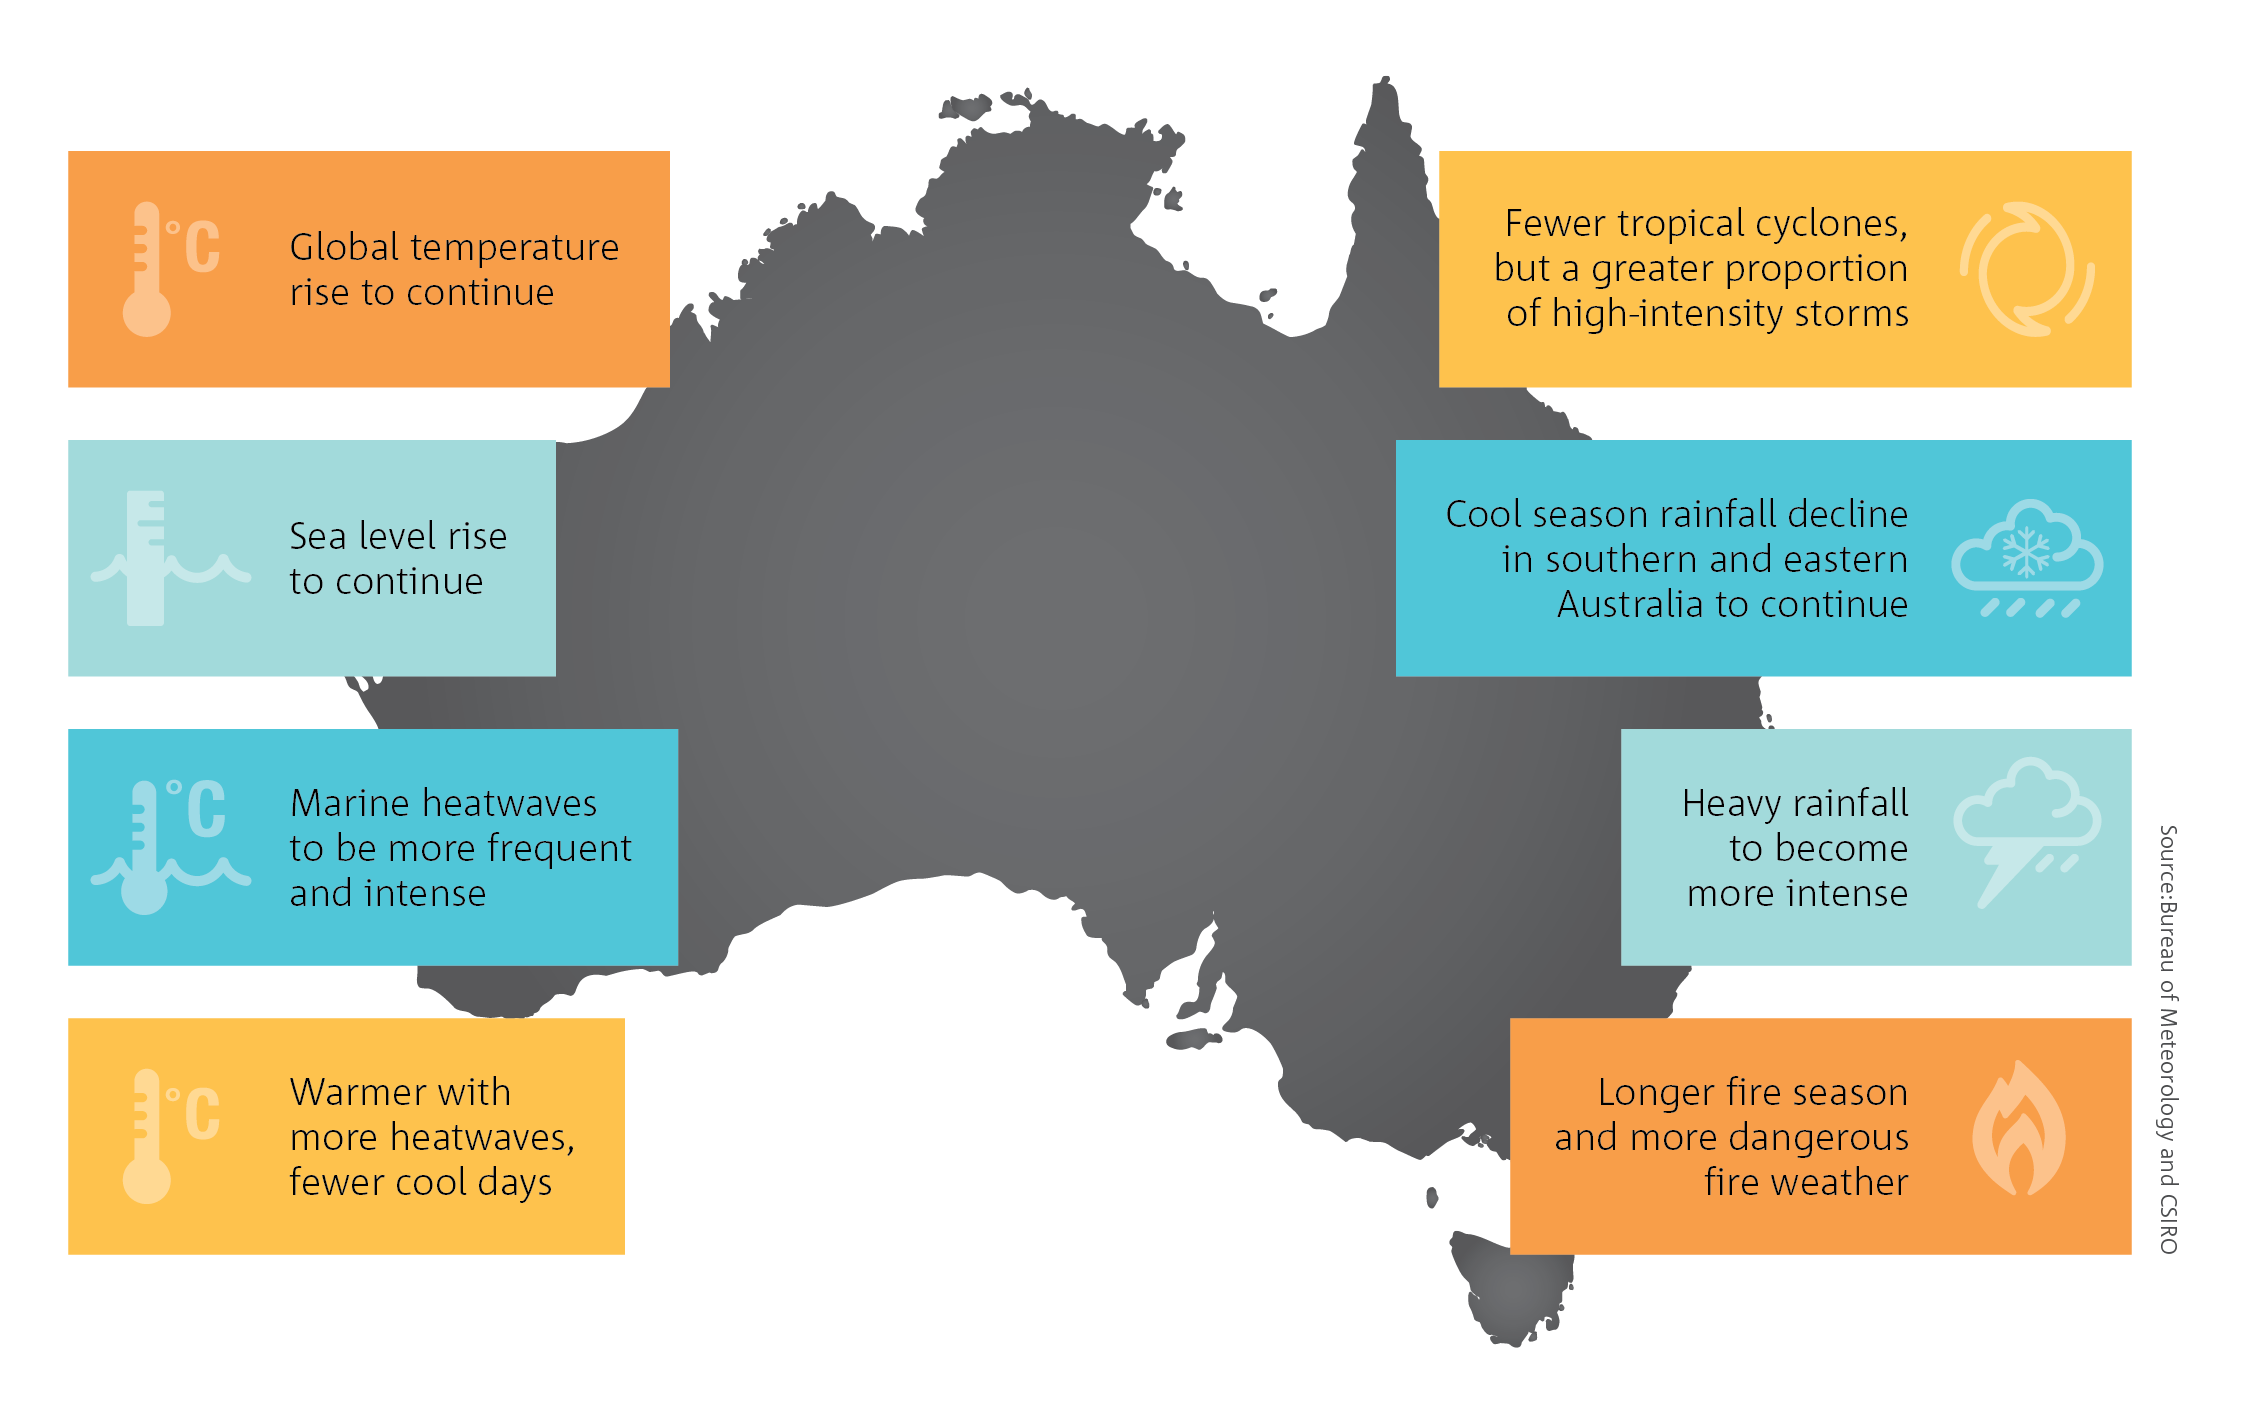
A new set of simulations from the latest generation of global climate models are now available, including simulations from Australia’s climate model, ACCESS. Analyses show that these new results are largely consistent with the existing projections for Australia at www.climatechangeinaustralia.gov.au, and add new insights. They show that over the coming decades, Australia is projected to experience:
- Continued warming, with more extremely hot days and fewer extremely cool days.
- A decrease in cool season rainfall across many regions of the south and east, likely leading to more time spent in drought.
- A longer fire season for the south and east and an increase in the number of dangerous fire weather days.
- More intense short-duration heavy rainfall events throughout the country.
- Fewer tropical cyclones, but a greater proportion projected to be of high intensity, with ongoing large variations from year to year.
- Fewer east coast lows particularly during the cooler months of the year. For events that do occur, sea level rise will increase the severity of some coastal impacts.
- More frequent, extensive, intense and longer-lasting marine heatwaves leading to increased risk of more frequent and severe bleaching events for coral reefs, including the Great Barrier and Ningaloo reefs.
- Continued warming and acidification of its surrounding oceans.
- Ongoing sea level rise. Recent research on potential ice loss from the Antarctic ice sheet suggests that the upper end of projected global mean sea level rise could be higher than previously assessed (as high as 0.61 to 1.10 m global average by the end of the century for a high emissions pathway, although these changes vary by location).
- More frequent extreme sea levels. For most of the Australian coast, extreme sea levels that had a probability of occurring once in a hundred years are projected to become an annual event by the end of this century with lower emissions, and by mid-century for higher emissions.
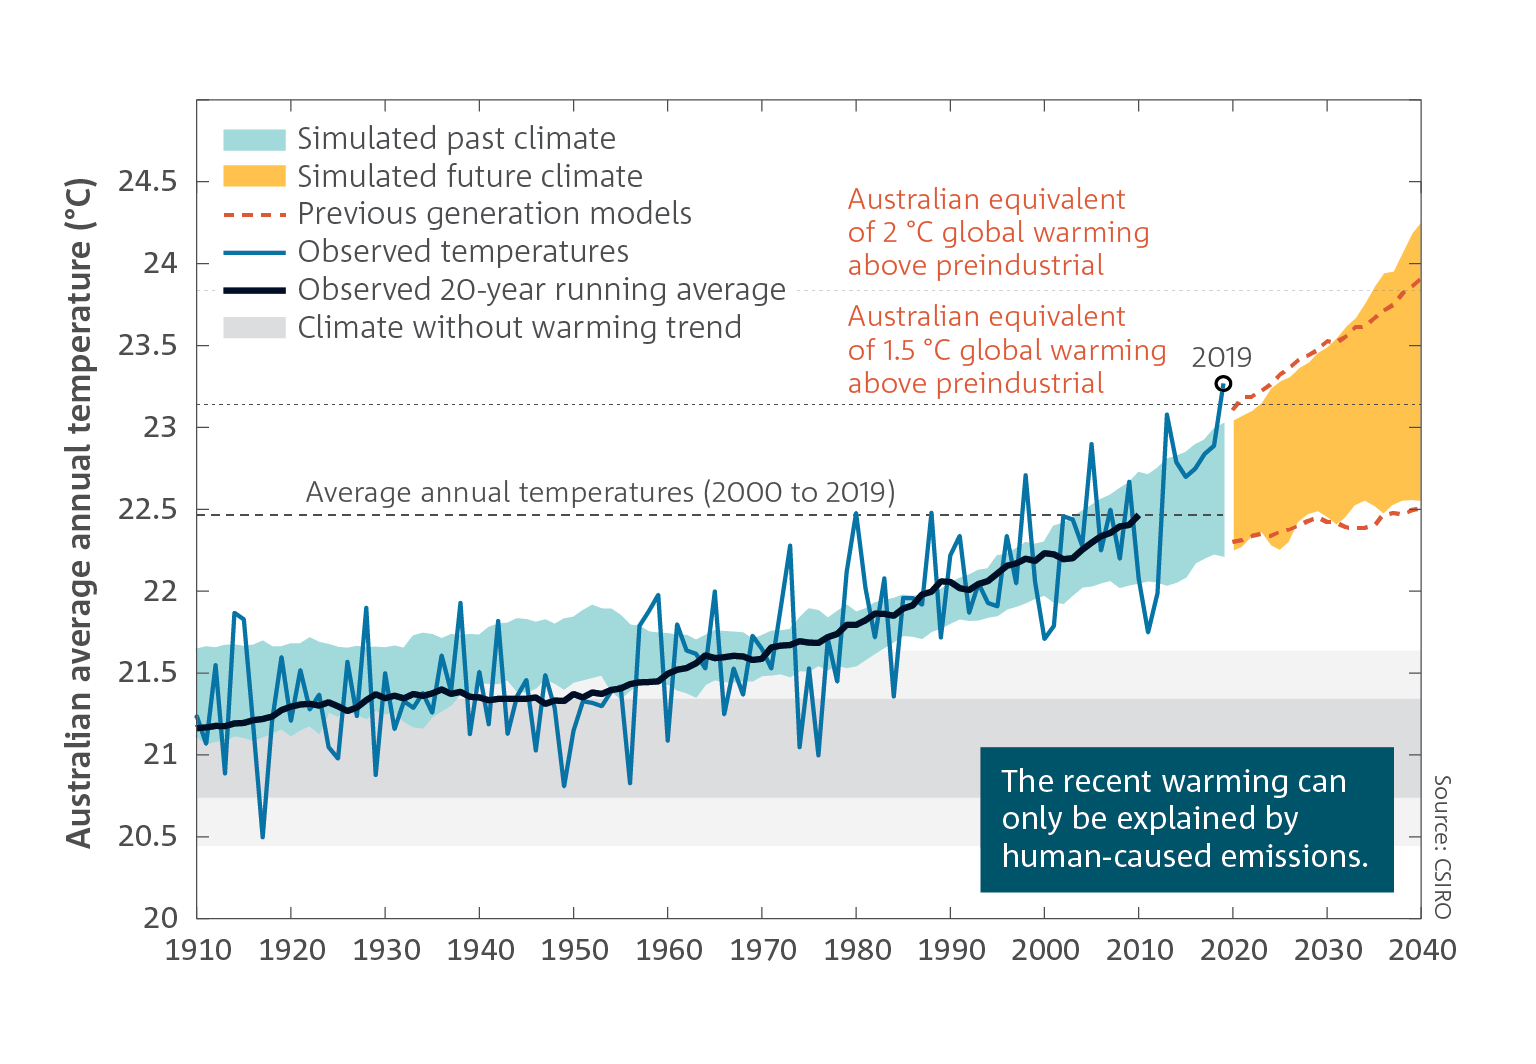 Projections of Australia’s average temperature over the next two decades show:
- Every year is now warmer than the range it would have been in a world without human influence, known as climate change ‘emergence’.
- The year 2019 was Australia’s hottest year on record, due to the combination of climate variability and long-term warming. This is expected to be an average year in a world where the global mean temperature is 1.5 °C above the pre-industrial baseline period of 1850–1900.
- While the current decade is warmer than any other decade over the last century, it is also likely to be the coolest decade for the century ahead.
- The average temperature of the next 20 years is virtually certain to be warmer than the average of the last 20 years.
- The amount of climate change expected in the next decade is similar under all plausible global emissions scenarios. However, by the mid-21st century, higher ongoing emissions of greenhouse gases will lead to greater warming and associated impacts, while reducing emissions will lead to less warming and fewer impacts.
Evaluation of average annual rainfall projections for Australia
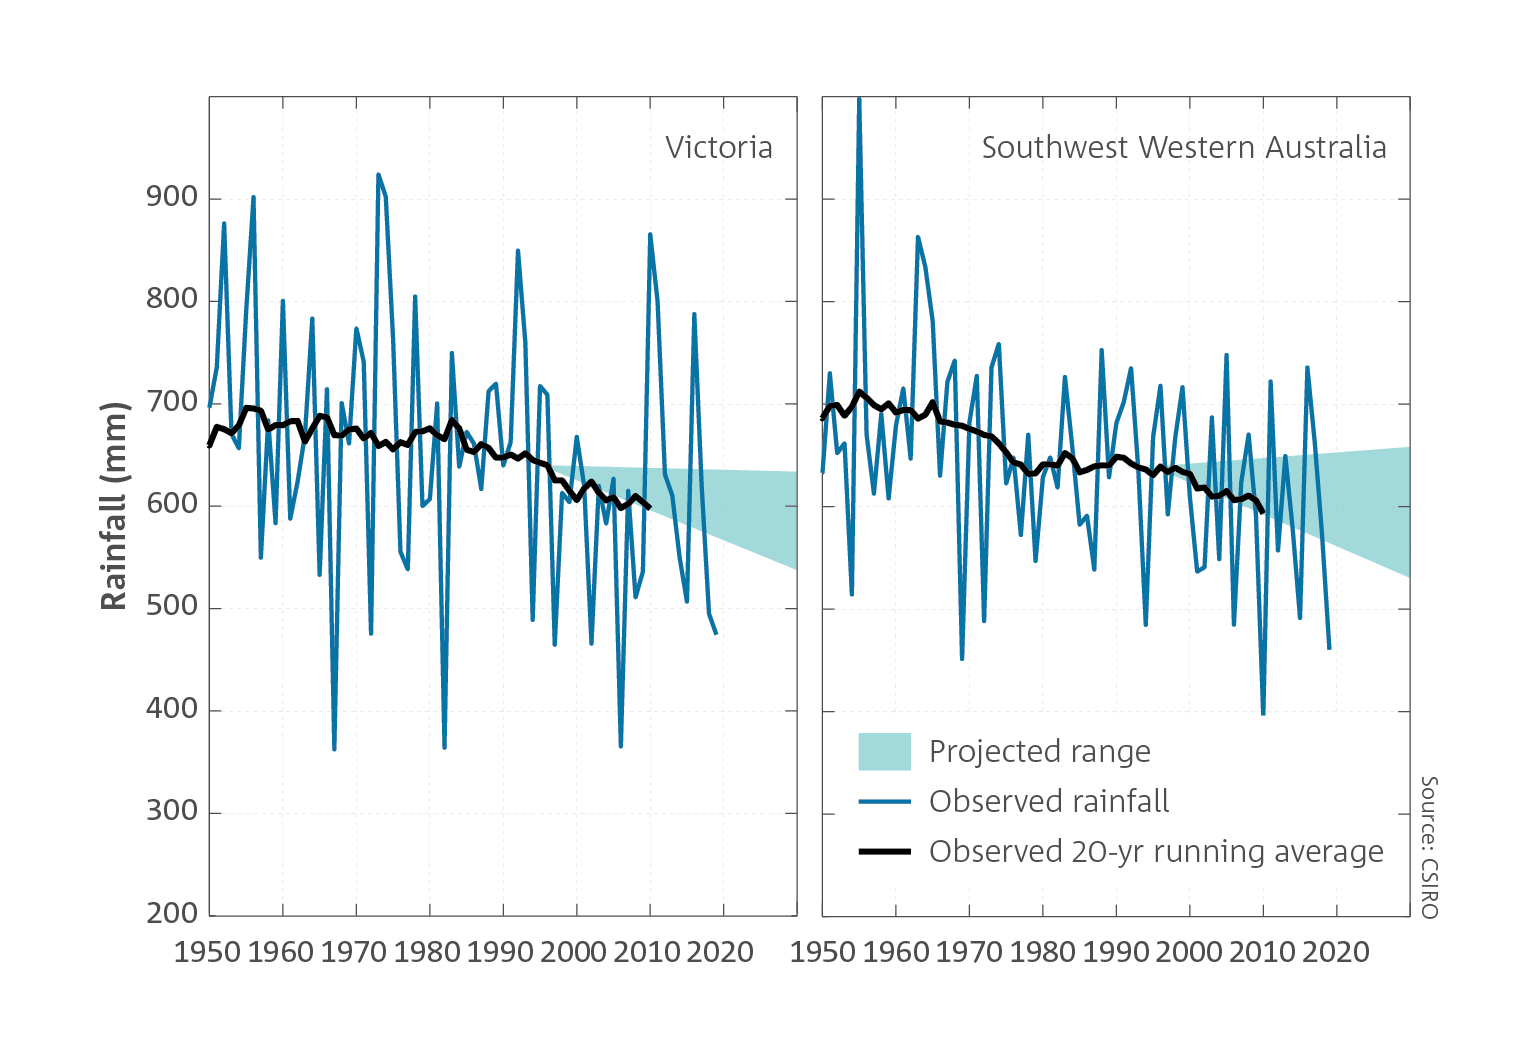 Climate projections are given for a future climate period relative to a past baseline. Recent climate projections estimated changes in rainfall from 1986–2005 to 2020–2039. Now that it is 2020, we can see how the observed rainfall trend is tracking against these projections. This is an indication of their reliability thus far, noting that the projections can’t be fully evaluated until the climate of 2020–2039 has emerged in its entirety.
Rainfall in southwest and southeast Australia has been declining in recent decades and is projected to likely decline further, especially in the cooler half of the year. The observed 20-year running average annual rainfall has been tracking the dry end of the projections (even though year-to-year values may fall outside the range), showing that the observed trends are consistent with these projected changes in rainfall. Importantly there is no evidence that the climate projections are overestimating the ongoing drying trend to date.
A new set of simulations from the latest generation of global climate models are now available, including simulations from Australia’s climate model, ACCESS. Analyses show that these new results are largely consistent with the existing projections for Australia at www.climatechangeinaustralia.gov.au, and add new insights. They show that over the coming decades, Australia is projected to experience:
- Continued warming, with more extremely hot days and fewer extremely cool days.
- A decrease in cool season rainfall across many regions of the south and east, likely leading to more time spent in drought.
- A longer fire season for the south and east and an increase in the number of dangerous fire weather days.
- More intense short-duration heavy rainfall events throughout the country.
- Fewer tropical cyclones, but a greater proportion projected to be of high intensity, with ongoing large variations from year to year.
- Fewer east coast lows particularly during the cooler months of the year. For events that do occur, sea level rise will increase the severity of some coastal impacts.
- More frequent, extensive, intense and longer-lasting marine heatwaves leading to increased risk of more frequent and severe bleaching events for coral reefs, including the Great Barrier and Ningaloo reefs.
- Continued warming and acidification of its surrounding oceans.
- Ongoing sea level rise. Recent research on potential ice loss from the Antarctic ice sheet suggests that the upper end of projected global mean sea level rise could be higher than previously assessed (as high as 0.61 to 1.10 m global average by the end of the century for a high emissions pathway, although these changes vary by location).
- More frequent extreme sea levels. For most of the Australian coast, extreme sea levels that had a probability of occurring once in a hundred years are projected to become an annual event by the end of this century with lower emissions, and by mid-century for higher emissions.
Projections of Australia’s average temperature over the next two decades show:
- Every year is now warmer than the range it would have been in a world without human influence, known as climate change ‘emergence’.
- The year 2019 was Australia’s hottest year on record, due to the combination of climate variability and long-term warming. This is expected to be an average year in a world where the global mean temperature is 1.5 °C above the pre-industrial baseline period of 1850–1900.
- While the current decade is warmer than any other decade over the last century, it is also likely to be the coolest decade for the century ahead.
- The average temperature of the next 20 years is virtually certain to be warmer than the average of the last 20 years.
- The amount of climate change expected in the next decade is similar under all plausible global emissions scenarios. However, by the mid-21st century, higher ongoing emissions of greenhouse gases will lead to greater warming and associated impacts, while reducing emissions will lead to less warming and fewer impacts.
Evaluation of average annual rainfall projections for Australia
Climate projections are given for a future climate period relative to a past baseline. Recent climate projections estimated changes in rainfall from 1986–2005 to 2020–2039. Now that it is 2020, we can see how the observed rainfall trend is tracking against these projections. This is an indication of their reliability thus far, noting that the projections can’t be fully evaluated until the climate of 2020–2039 has emerged in its entirety.
Rainfall in southwest and southeast Australia has been declining in recent decades and is projected to likely decline further, especially in the cooler half of the year. The observed 20-year running average annual rainfall has been tracking the dry end of the projections (even though year-to-year values may fall outside the range), showing that the observed trends are consistent with these projected changes in rainfall. Importantly there is no evidence that the climate projections are overestimating the ongoing drying trend to date.