Sea surface temperature
- Sea surface temperatures have risen around Australia; the ocean surface has warmed by over a degree since 1900.
Average sea surface temperature in the Australian region has warmed by more than 1 °C since 1900, with eight of the ten warmest years on record occurring since 2010. The warmest year on record was 2016, associated with one of the strongest negative Indian Ocean Dipole events on record.
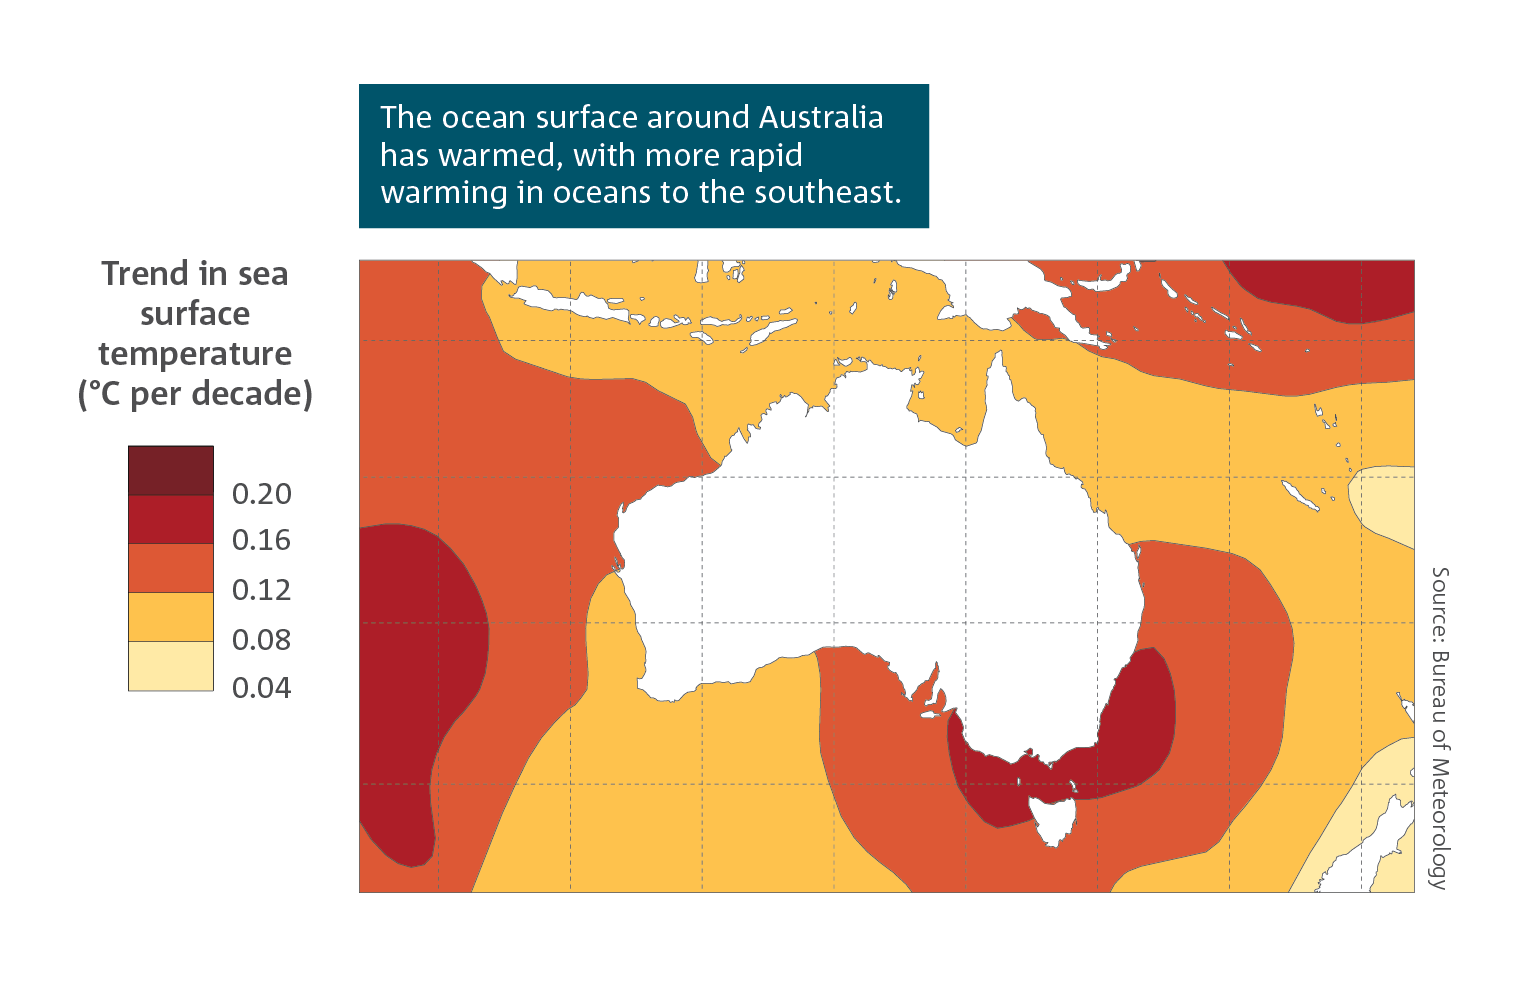 The greatest ocean warming in the Australian region since 1970 has occurred around southeastern Australia and Tasmania. The East Australian Current now extends further south, creating an area of more rapid warming in the Tasman Sea where the warming rate is now twice the global average. There has also been warming across large areas of the Indian Ocean region to the southwest of Australia.
Warming of the ocean has contributed to longer and more frequent marine heatwaves. Marine heatwaves are defined as periods when temperatures are in the upper range of historical baseline conditions for five days or more. Heatwaves in the ocean often persist much longer than heatwaves on land, sometimes spanning multiple months or even years.
The increasing frequency of marine heatwaves around Australia in recent years has caused permanent impacts on marine ecosystem health, marine habitats and species. These impacts include depleting kelp forests and sea grasses, a poleward shift in some marine species, and increased occurrence of disease. Recent marine heatwaves are the primary cause of mass coral bleaching and widespread damage to coral reefs around Australia, including the Great Barrier and Ningaloo reefs although other pressures such as tropical cyclones, nutrient runoff and disease also affect the health of some areas of the Great Barrier Reef.
Ocean heat content
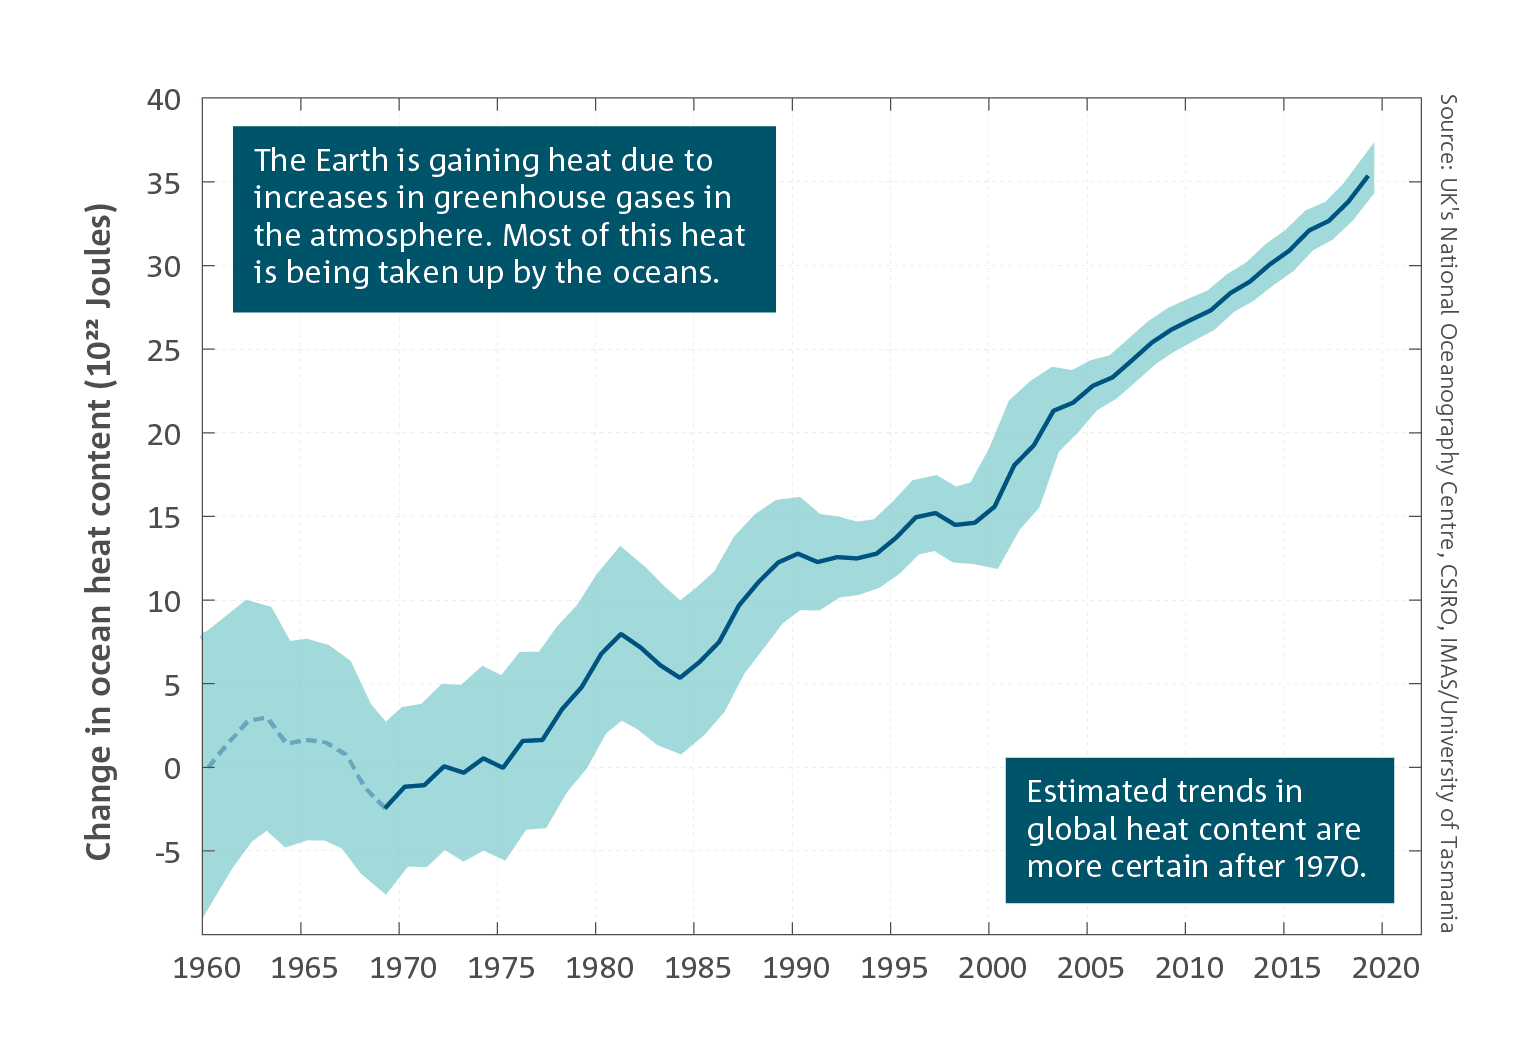
- The world’s oceans are taking up around 90 per cent of the extra energy stored by the planet as a result of enhanced greenhouse gas concentrations. Measuring changes in ocean heat content is therefore an accurate way to monitor global warming.
- The rate at which the oceans are taking up heat has increased over recent decades.
The world’s oceans are a major component of the Earth’s climate system and have a profound effect on the climate by redistributing heat and influencing wind patterns. Sea water stores about four times more heat for every degree of temperature rise than dry air of the same weight.
The total weight of water in the ocean is about 280 times greater than the weight of the Earth’s atmosphere, so the capacity for the ocean to store heat is vast. For example, if all the extra energy stored in the oceans was released to the atmosphere, the resulting temperature change in the atmosphere would be approximately 1000 times larger than the equivalent temperature change in the ocean.
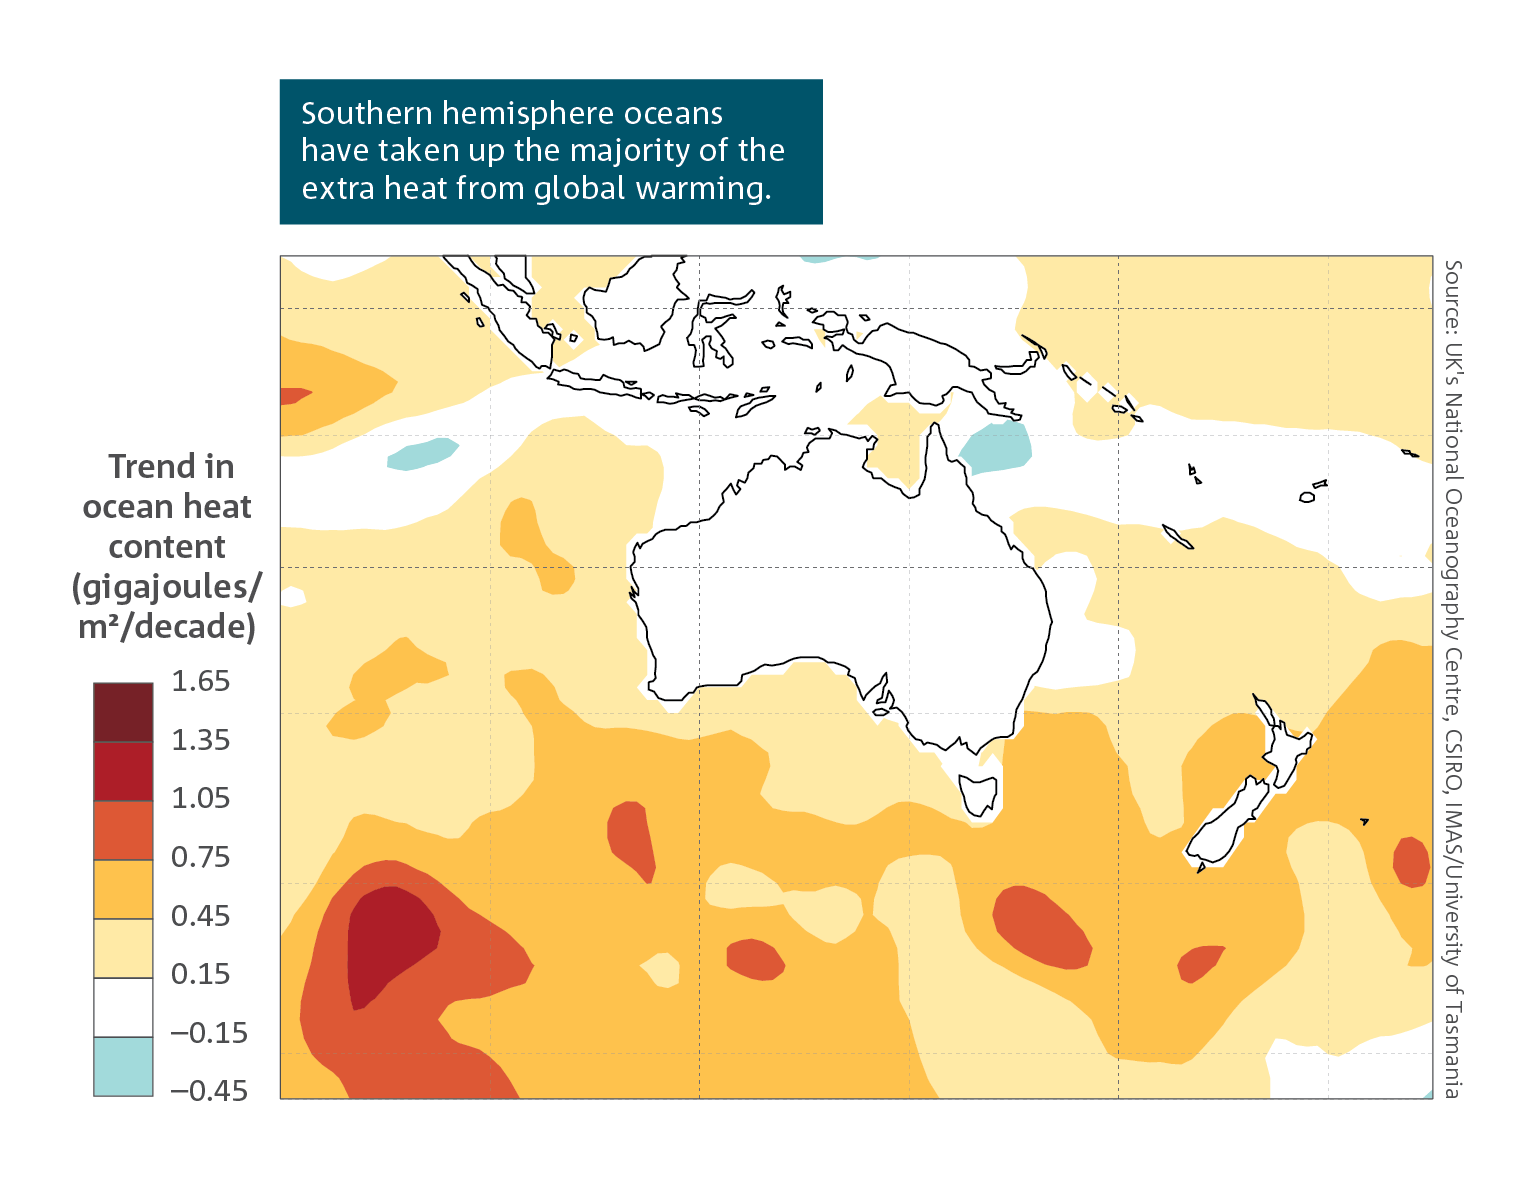
While the absolute temperature changes over the whole ocean depth are small compared to those at the land and ocean surface, the ocean has taken up approximately 90 per cent of the extra energy from enhanced greenhouse gas concentrations. Oceans have therefore slowed the rate of warming near the Earth’s land and ocean surface. Heat absorbed at the surface is redistributed both horizontally and vertically by ocean circulation. As a result, the ocean is warming both near the surface and at depth, with the rate of warming varying between regions and depths.
The rate at which oceans are taking up heat has increased in recent decades. Over its full depth, the global ocean gained 35 x 1022 joules of additional heat from 1960 to 2019. Southern hemisphere oceans take up much of the extra heat. This is because the Southern Ocean circulation takes heat from near the surface and transfers it into the deep ocean. A warming ocean affects the global ocean and atmospheric circulation, global and regional sea levels, uptake of anthropogenic CO2, and causes losses in oxygen and impacts on marine ecosystems.
Long-term temperature trends in the deep ocean, below 2000 metres, show a slow but steady warming. However, there are currently far fewer observations below this depth compared to the upper ocean, so the magnitude of this warming is less certain.
Marine heatwaves and coral reefs
Warming oceans, together with an increase in the frequency, intensity and duration of marine heatwaves, pose a significant threat to the long-term health and resilience of coral reef ecosystems. Globally, large-scale mass coral bleaching events have occurred with increasing frequency and extent since the 1970s. Large‑scale bleaching is a stress response of corals that occurs primarily in response to elevated ocean temperature. As waters warm, the symbiotic relationship between coral and its zooxanthellae (single‑celled organisms that live within the corals) breaks down, eventually resulting in coral bleaching where the zooxanthellae are expelled. Without zooxanthellae, most corals struggle to survive. Recovery is possible, but mortality can occur if the thermal stress is too severe or prolonged.
Bleaching on the Great Barrier Reef has occurred with increased frequency in recent decades. Widespread bleaching occurred in 1998 and 2002, however over the last 10 years three mass coral bleaching events have occurred in 2016, 2017 and 2020. In 2016, bleaching was associated with some of the warmest sea surface temperatures ever recorded which, in turn, led to the largest recorded mass bleaching on the Great Barrier Reef. The impact of the mass bleaching in 2020 appears to be second only to 2016 and was associated with severely bleached coastal reefs along the entire 2300 km length of the Great Barrier Reef.
These three recent bleaching events are associated with marine heatwaves driven by anthropogenic climate change. Rapidly recurring bleaching events do not give the reef ecosystem time to recover from the damage caused by these events.
Climate models project more frequent, extensive, intense and longer-lasting marine heatwaves in the future. Coupled with a background warming of ocean temperatures, this implies more frequent and severe coral bleaching events are likely on the Great Barrier Reef and globally, leading to the potential loss of many types of coral throughout tropical reef systems worldwide. Along with ocean acidification and nutrient runoff, the increased severity and frequency of marine heatwaves are likely to reduce reef resilience and hinder coral recovery from future bleaching events.
Worsening impacts on coral reefs from marine heatwaves are expected in the future with continued warming but the intensification of marine heatwaves is much larger with higher global greenhouse gas emissions.
Sea level
- Global mean sea level has risen by around 25 cm since 1880; half of this rise has occurred since 1970.
- Rates of sea level rise vary across the Australian region, with the largest increases to the north and southeast of the Australian continent.
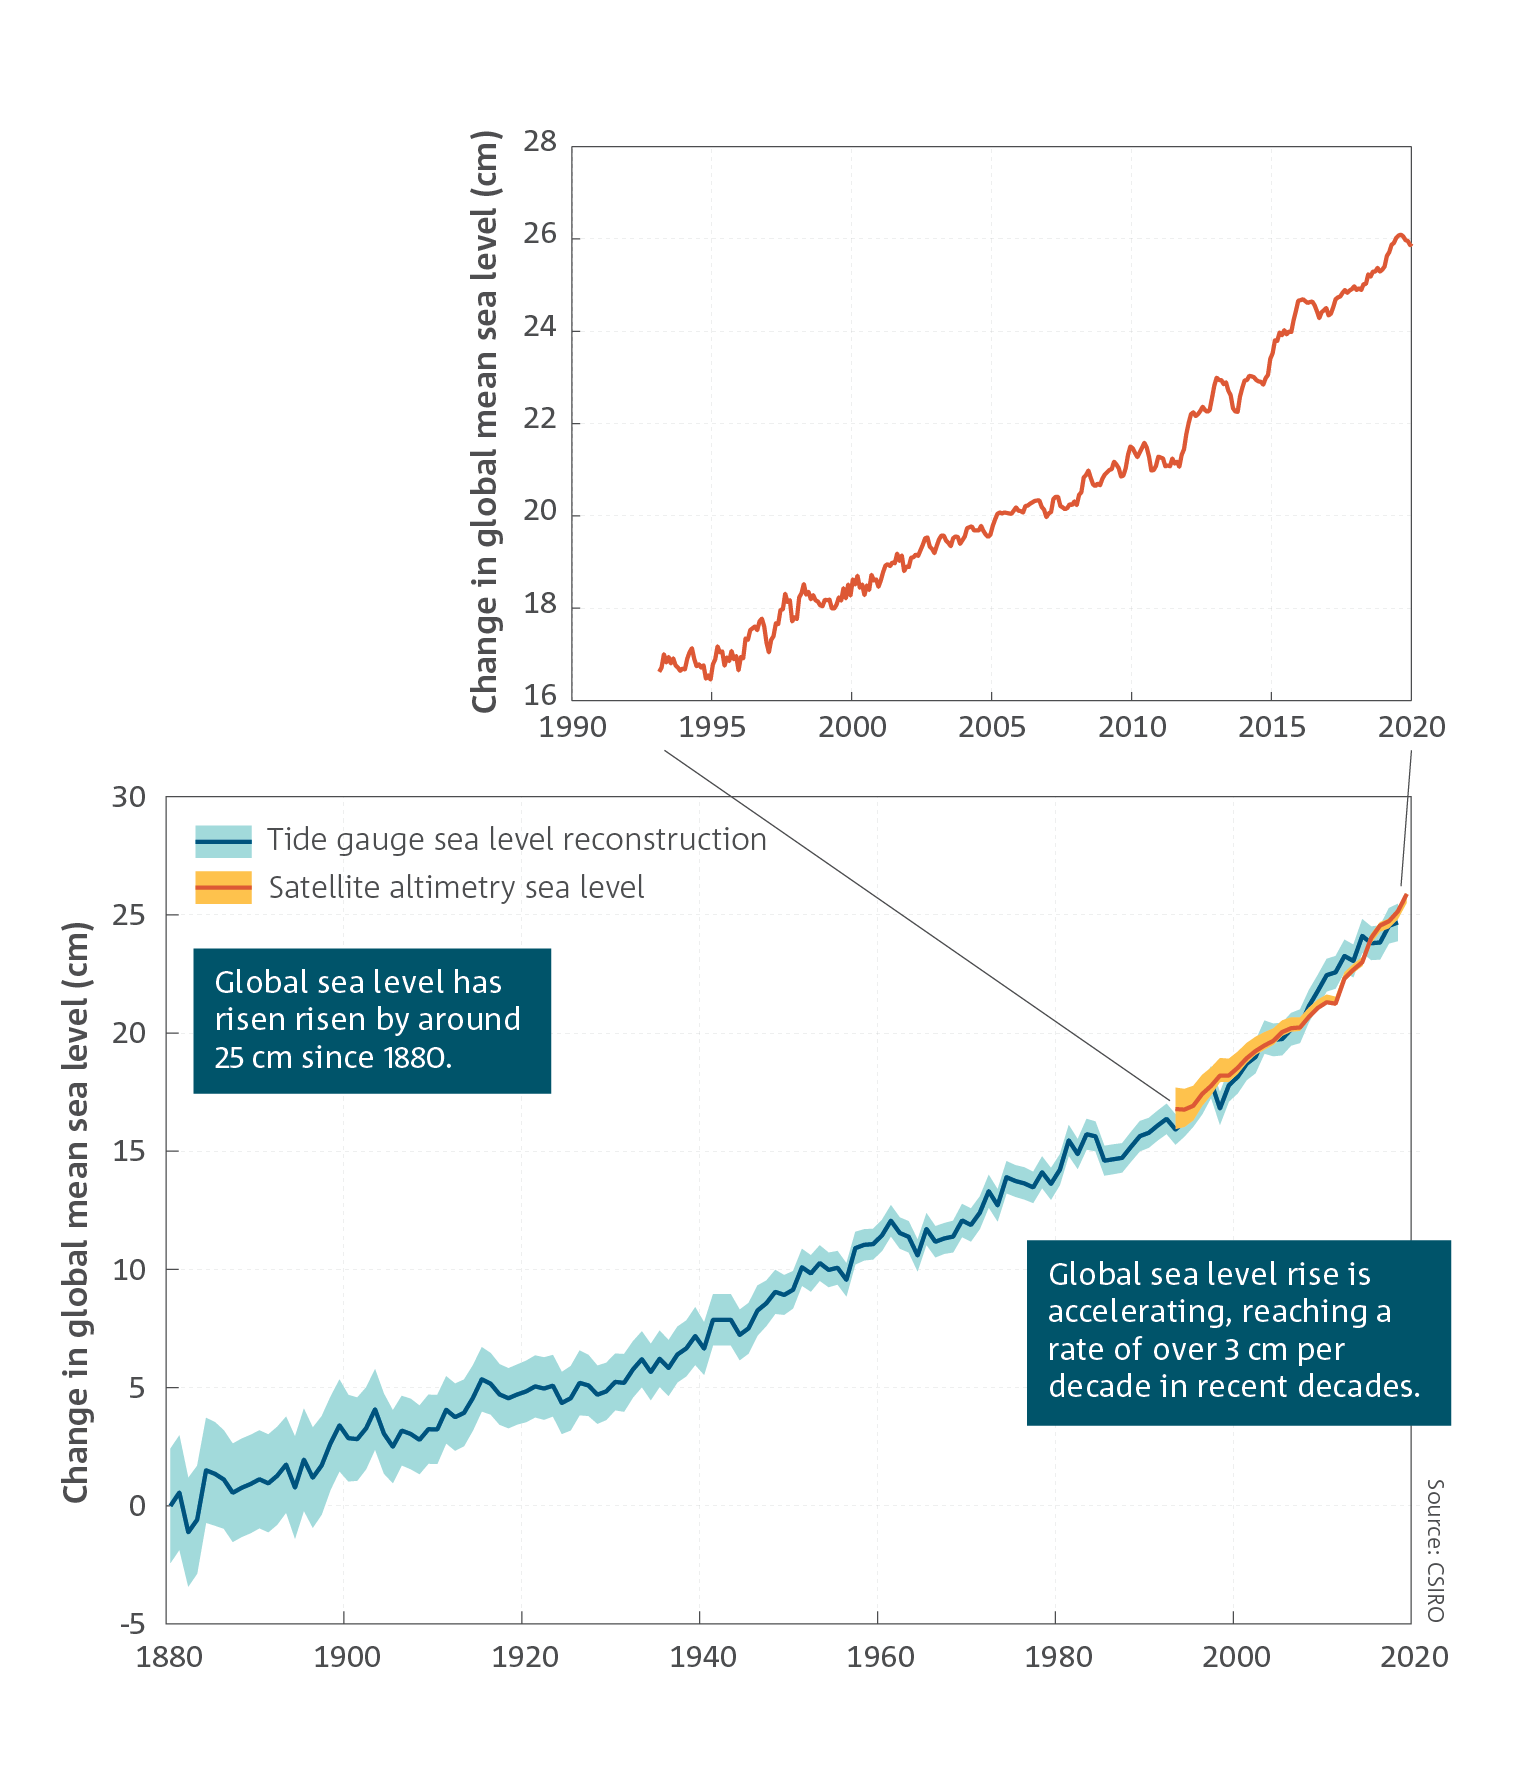 As the ocean warms it expands and sea level rises. This thermal expansion has contributed about one third of the sea level rise observed globally, around 25 cm since the late 19th century. Ice loss from glaciers and polar ice sheets, together with changes in the amount of water stored on the land, contribute the remaining two thirds of the observed global sea level rise. Ice loss from Greenland, Antarctica and glaciers has been the dominant contributor to global sea level rise from 1993 to the present.
Global mean sea level rise is accelerating. Tide gauge and satellite altimetry observations show that the rate of global mean sea level rise increased from 1.5 ± 0.2 cm per decade (1901–2000) to 3.5 ± 0.4 cm per decade (1993–2019). The dominant cause of global mean sea level rise since 1970 is anthropogenic climate change.
Confidence in assessing changes in mean global sea level has continuously improved because there has been more analysis of satellite altimetry and longer
records. Efforts to reliably quantify the various contributions to sea level rise have also led to greater confidence and process understanding.
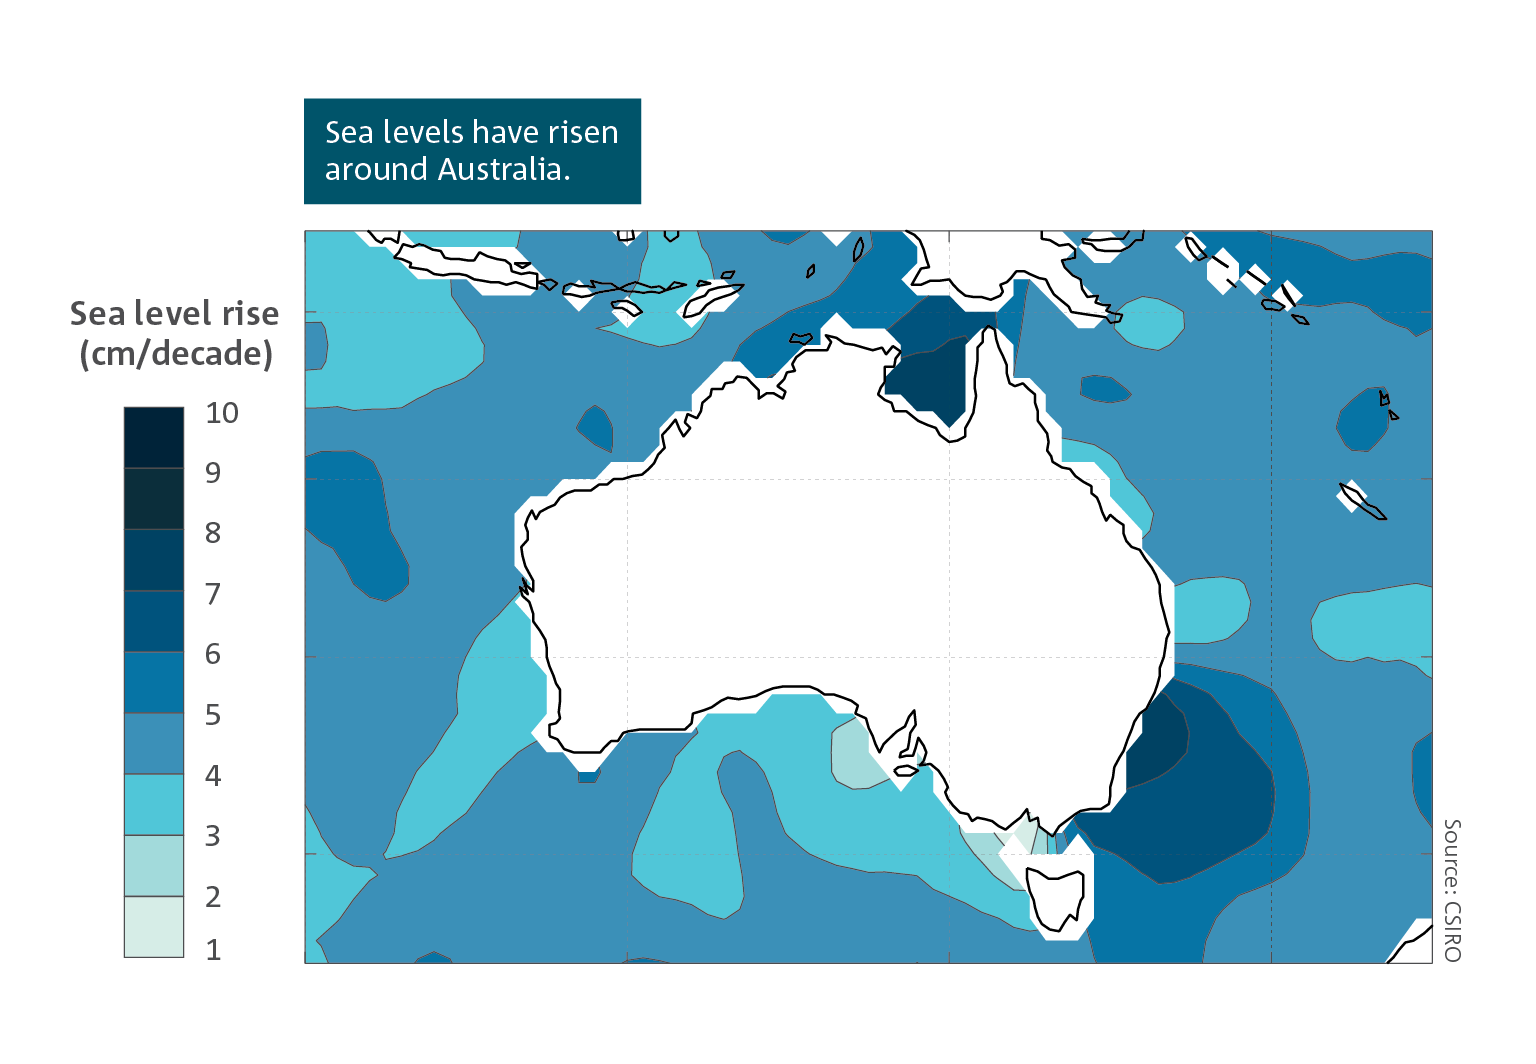 Australia, like other nations, is already experiencing sea level rise. Sea level varies from year to year and from place to place, partly due to the natural variability of the climate system from the effect of climate drivers such as El Niño and La Niña. Based on satellite altimetry observations since 1993, the rates of sea level rise to the north and southeast of Australia have been significantly higher than the global average, whereas rates of sea level rise along the other coasts of the continent have been closer to the global average.
The long-term altimetry sea level record is typically restricted to the offshore region, beyond 25–50 km, while changes closer to Australia’s shoreline are estimated from tide gauge measurements at a limited number of locations. Local coastal processes, the effects of vertical land motion, and changes in site and/or reference levels affect local estimates of sea level change. For example, estimates from nearshore tide gauge measurements may differ from estimates derived from satellite altimetry tens of kilometres offshore. Nevertheless, tide gauges with good long-term records around Australia show overall changes in sea level rise consistent with offshore observations from satellite altimetry.
Rising sea levels pose a significant threat to coastal communities by amplifying the risks of coastal inundation, storm surge and erosion. Coastal communities in Australia are already experiencing some of these changes.
Ocean acidification
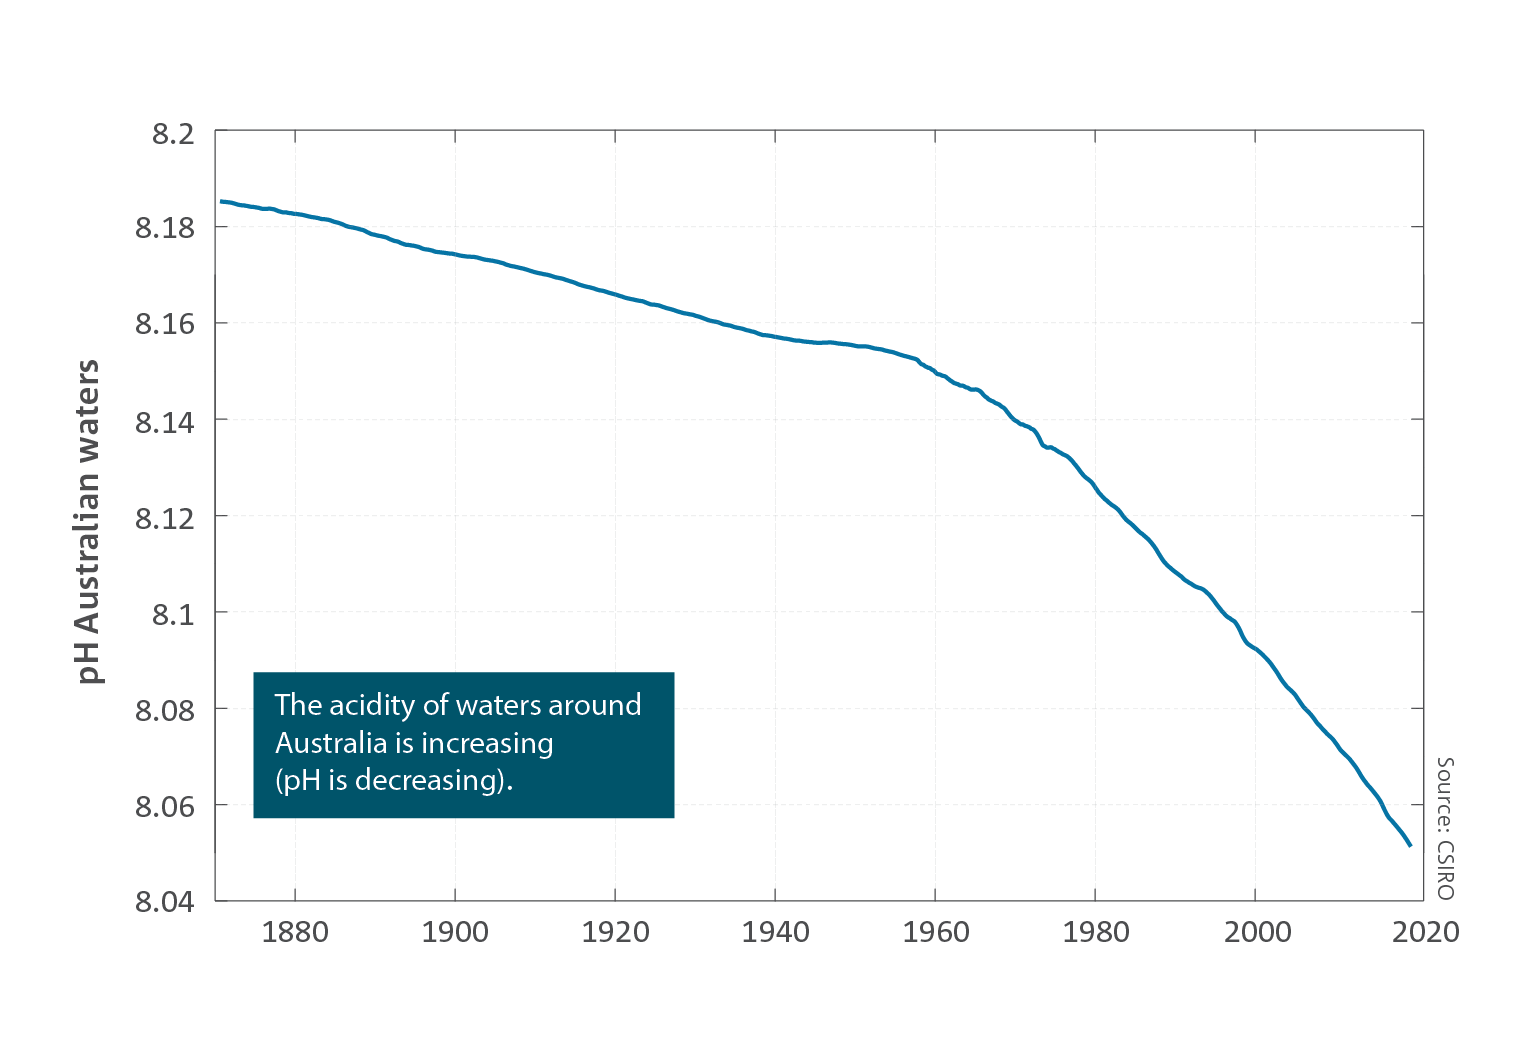
- The acidification of the oceans around Australia continues (pH is decreasing), and the impacts of these changes are detectable in areas such as the Great Barrier Reef.
Rising atmospheric CO2 levels increase the uptake of CO2 by the oceans, which affects their carbonate chemistry and decreases their pH; a process known as ocean acidification. In conjunction with other environmental changes, such as ocean warming and deoxygenation, ocean acidification brings additional pressures to the marine environment.
Impacts of ocean acidification to marine ecosystems include changes in reproduction, organism growth and physiology, species composition and distributions, food web structure, nutrient availability and reduced calcification rate. The last of these is particularly important for species that produce shells or skeletons of calcium carbonate, such as corals and shellfish.
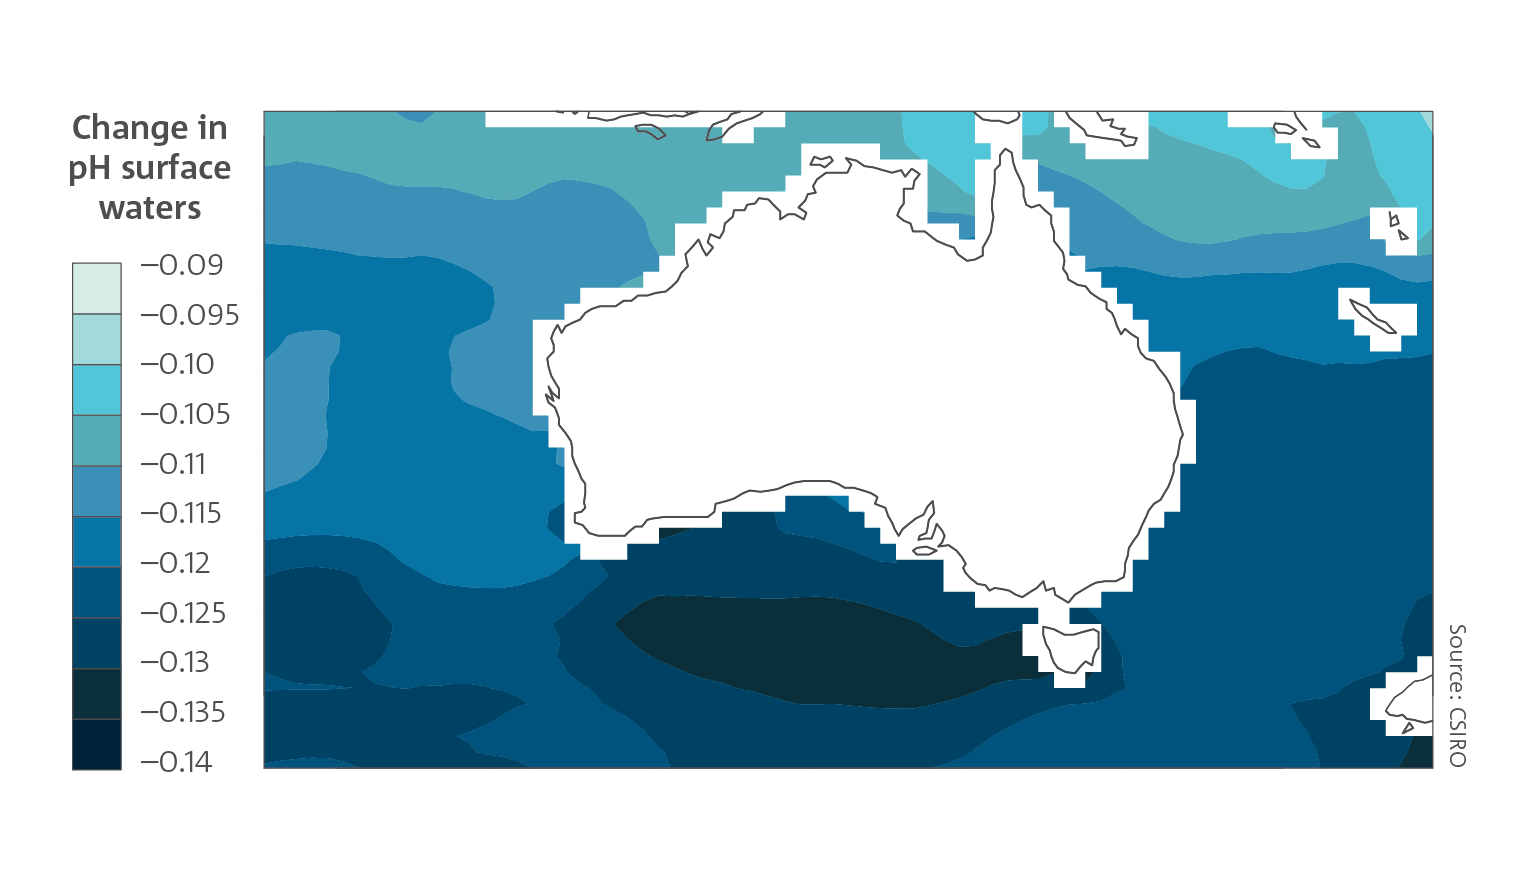
Between 1880–1889 and 2010–2019, the average pH of surface waters around Australia is estimated to have decreased by about 0.12. This corresponds to a more than 30 per cent increase in acidity (and so the waters have become less alkaline). Due to latitudinal differences in ocean chemistry, the oceans to the south of Australia are acidifying faster than those to the north.
The rate of decrease in pH has accelerated to over 0.02 per decade, more than five times faster than from 1900 to 1960. This current rate of change is also 10 times faster than at any time in the past 300 million years. These changes have led to a significant reduction in coral calcification and growth rates on coral reefs such as the Great Barrier Reef, which affects their ability to recover from coral bleaching events.
Cryosphere
- The ice sheets and ice shelves of Antarctica and Greenland are losing ice and contributing to global sea level rise due to a warmer climate.
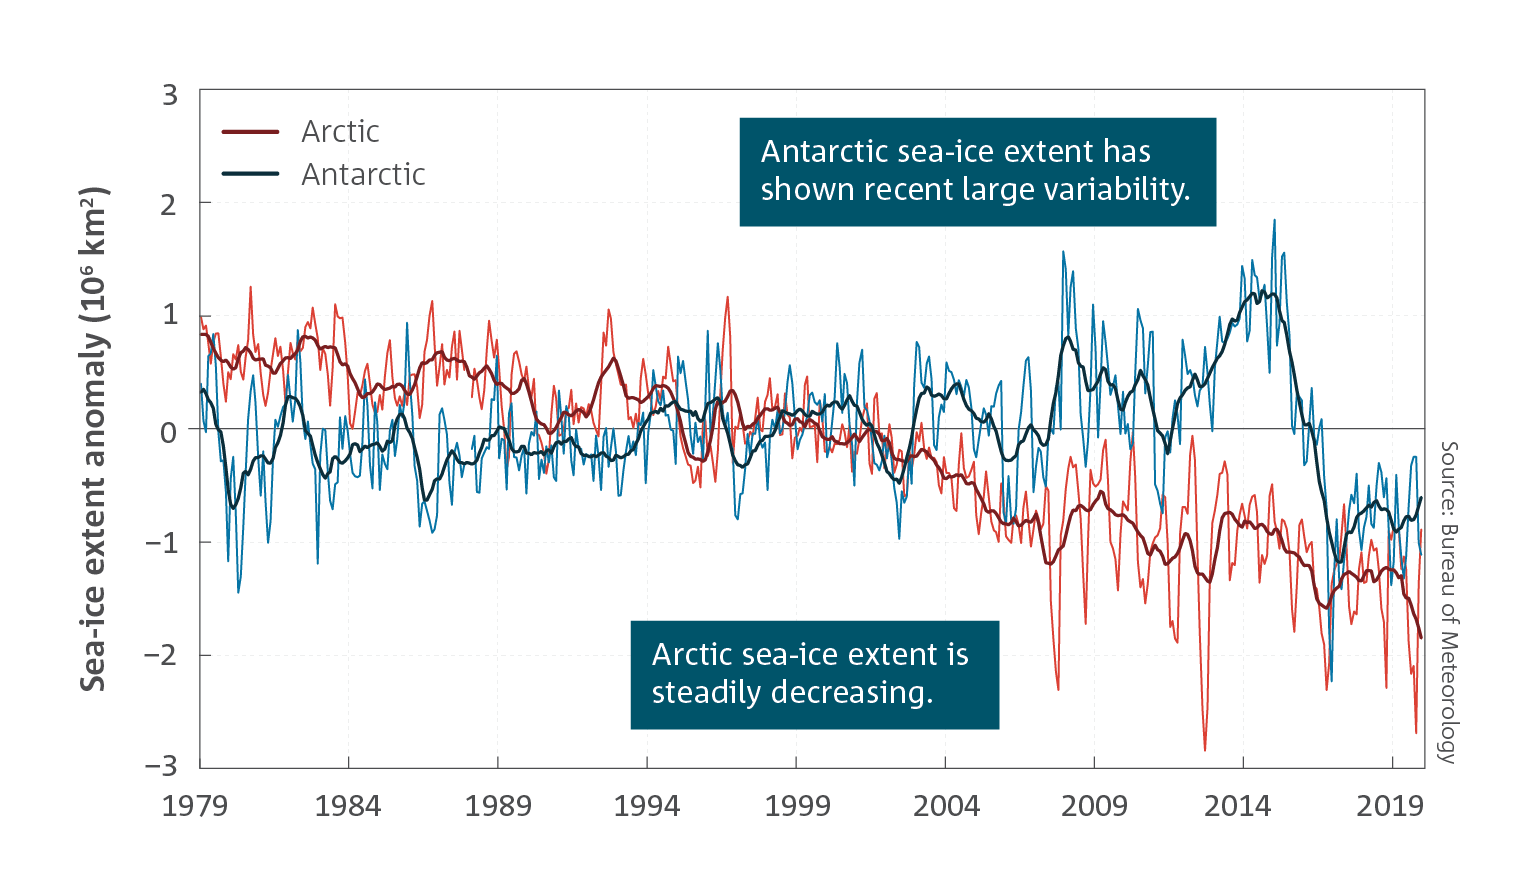
- The extent of sea ice in the Arctic has steadily reduced, while in the Antarctic there has been regional and seasonal variability in sea-ice cover.
 The Earth’s ice sheets—glacial ice that has accumulated from precipitation over land—and ice shelves, which are floating sheets of ice formed from glacial ice sheets, play crucial roles in our global climate system. Ice shelves help stabilise the Antarctic ice sheet by restricting the flow of glacial ice from the continent to the ocean. Warm ocean water penetrating below the ice shelves of the West Antarctic ice sheet is destabilising several glaciers, increasing the Antarctic contribution to sea level rise. Atmospheric warming is also causing surface melting of ice sheets and ice shelves, particularly in Greenland and on the Antarctic Peninsula. From 2003 to 2019, melt from Greenland and Antarctica combined contributed around 1.4 cm of global sea level rise.
Changes in sea ice have little direct impact on sea level because sea ice is frozen sea water that floats. When it melts it returns the original volume of water to the sea. However, the presence or absence of sea ice influences the climate, including the rate of regional climate warming. Antarctic sea ice also acts as a protective buffer for ice shelves against destructive ocean swells. Changes in Antarctic sea-ice cover can also be an indicator of wider climate changes because it is an integrator of ocean, atmosphere and cryosphere components, from local change to the tropics.
 Satellite monitoring of sea ice began in the late 1970s. Since then, Arctic sea‑ice cover has consistently decreased, whereas net sea-ice cover changes within the Antarctic have been mixed. Overall, Antarctic sea-ice extent showed a small increase from 1979 to 2014, but with substantial regional variations. The largest daily recorded wintertime extent of approximately 20.2 million km2 was in September 2014.
However, since then the sea‑ice cover has decreased to below the long-term average, with the lowest recorded daily summertime extent of approximately 2.1 million km2 occurring in 2017. The overall increase in Antarctic sea‑ice extent during 1979–2014 has mostly been attributed to changes in westerly wind strength, whereas the marked decrease from 2015 to 2017 was predominantly related to warming in the uppermost layers of the ocean.
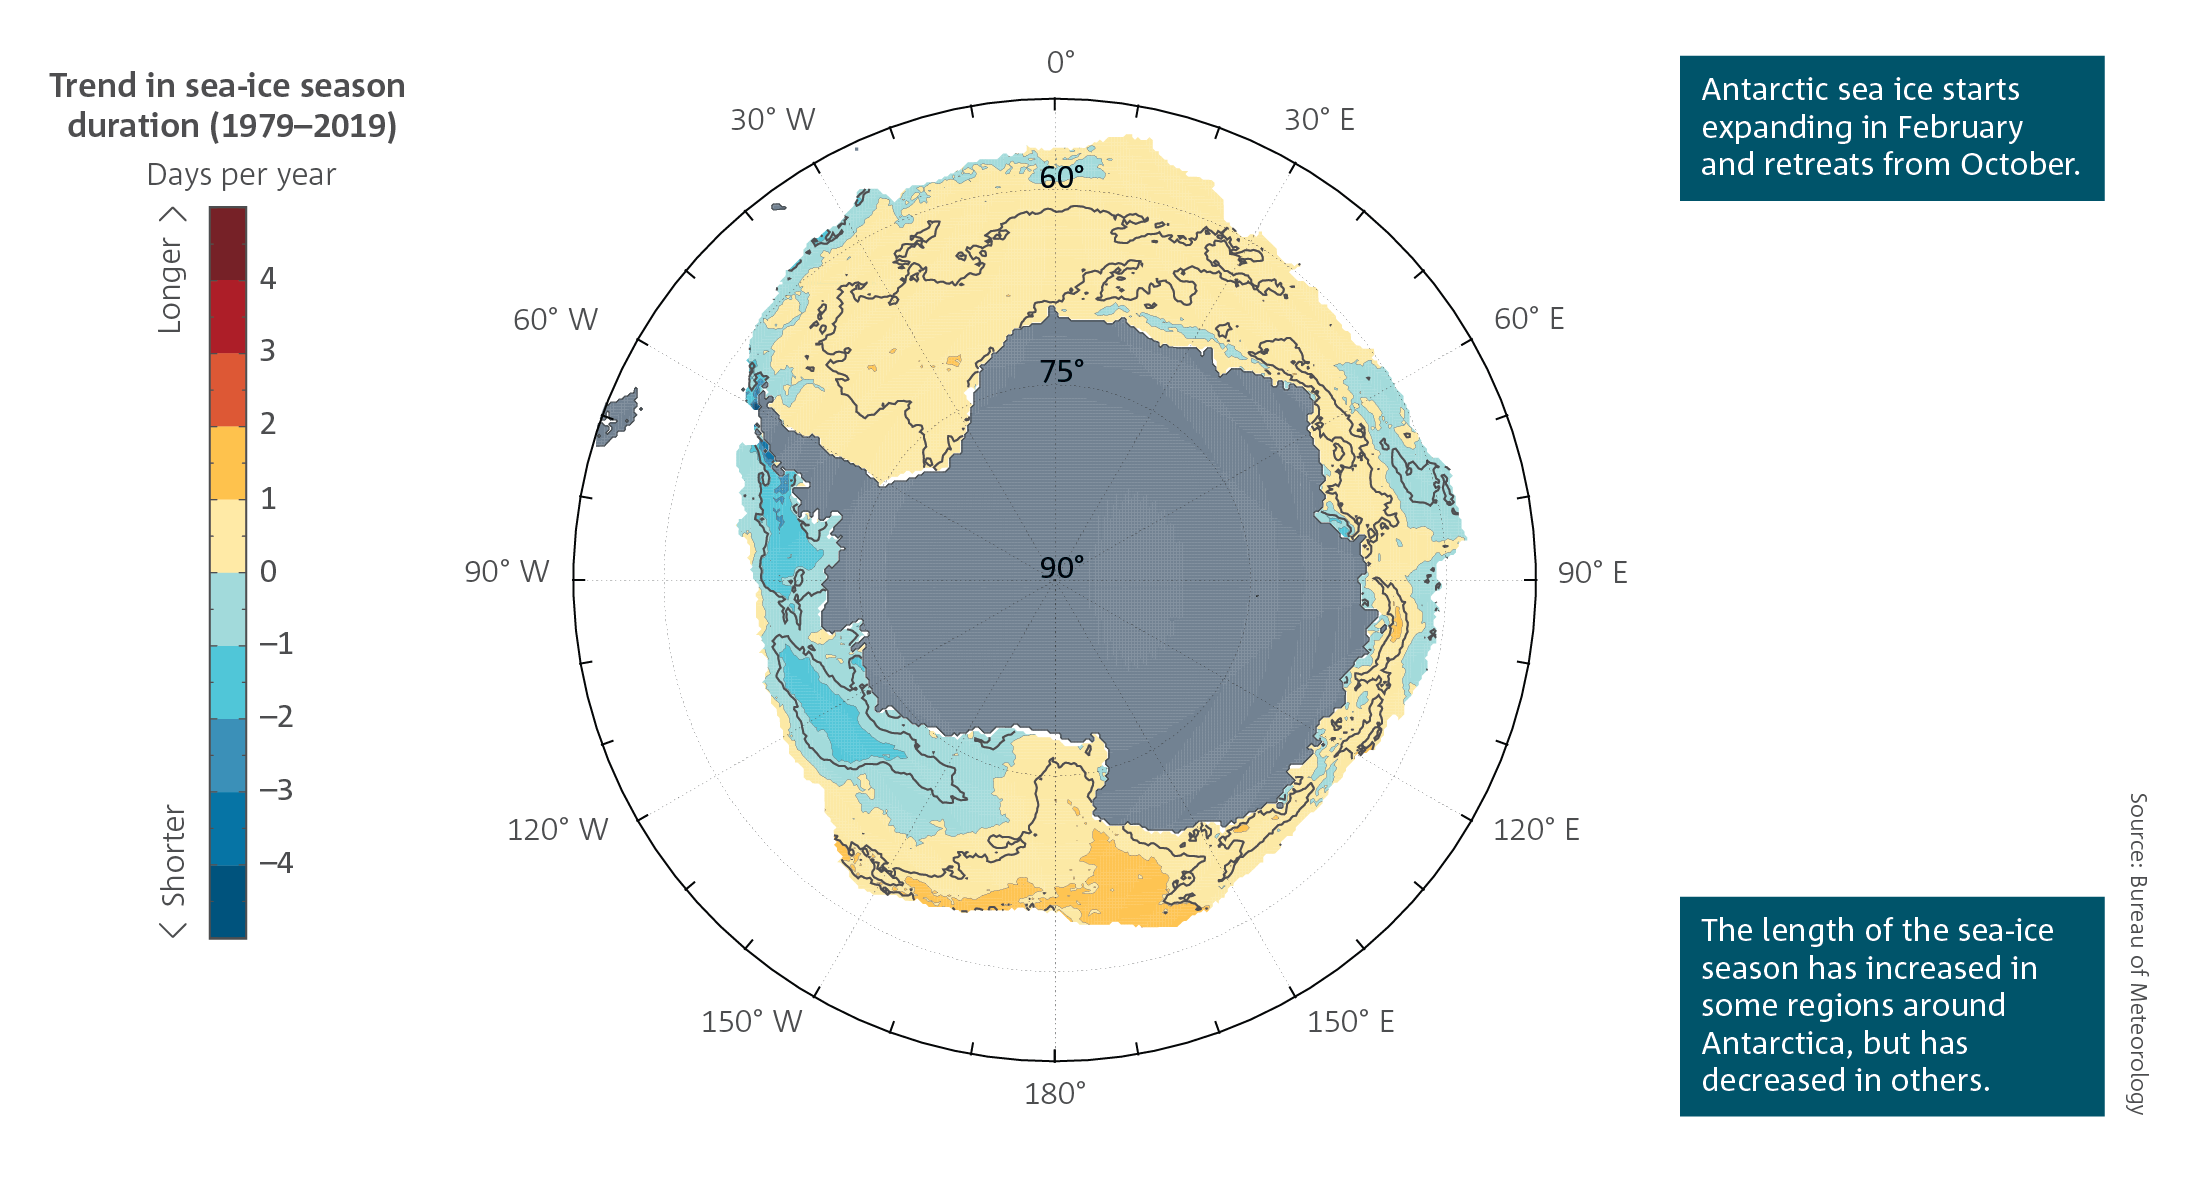
Observed changes in Antarctic sea-ice cover are also regionally variable, as depicted in the trends of yearly sea‑ice duration. Statistically significant increases of up to two days per year in sea-ice duration have occurred in the Ross Sea, between 160° E and 150° W. Decreases in sea-ice duration of as much as four days per year are seen west of the Antarctic Peninsula and the Bellingshausen Sea offshore of West Antarctica. Recent sea-ice seasons (since 2015) have shown opposite regional responses to the long-term trend.
Changes in the Arctic sea-ice cover, since 1979, have been more seasonally and regionally uniform than those in the Antarctic, with decreasing trends in all months and virtually all regions. Sea-ice thickness in the Arctic has also decreased steadily over the last few decades, making it easier to break and melt in springtime.
Sea surface temperature
- Sea surface temperatures have risen around Australia; the ocean surface has warmed by over a degree since 1900.
Average sea surface temperature in the Australian region has warmed by more than 1 °C since 1900, with eight of the ten warmest years on record occurring since 2010. The warmest year on record was 2016, associated with one of the strongest negative Indian Ocean Dipole events on record.
The greatest ocean warming in the Australian region since 1970 has occurred around southeastern Australia and Tasmania. The East Australian Current now extends further south, creating an area of more rapid warming in the Tasman Sea where the warming rate is now twice the global average. There has also been warming across large areas of the Indian Ocean region to the southwest of Australia.
Warming of the ocean has contributed to longer and more frequent marine heatwaves. Marine heatwaves are defined as periods when temperatures are in the upper range of historical baseline conditions for five days or more. Heatwaves in the ocean often persist much longer than heatwaves on land, sometimes spanning multiple months or even years.
The increasing frequency of marine heatwaves around Australia in recent years has caused permanent impacts on marine ecosystem health, marine habitats and species. These impacts include depleting kelp forests and sea grasses, a poleward shift in some marine species, and increased occurrence of disease. Recent marine heatwaves are the primary cause of mass coral bleaching and widespread damage to coral reefs around Australia, including the Great Barrier and Ningaloo reefs although other pressures such as tropical cyclones, nutrient runoff and disease also affect the health of some areas of the Great Barrier Reef.
Ocean heat content
- The world’s oceans are taking up around 90 per cent of the extra energy stored by the planet as a result of enhanced greenhouse gas concentrations. Measuring changes in ocean heat content is therefore an accurate way to monitor global warming.
- The rate at which the oceans are taking up heat has increased over recent decades.
The world’s oceans are a major component of the Earth’s climate system and have a profound effect on the climate by redistributing heat and influencing wind patterns. Sea water stores about four times more heat for every degree of temperature rise than dry air of the same weight.
The total weight of water in the ocean is about 280 times greater than the weight of the Earth’s atmosphere, so the capacity for the ocean to store heat is vast. For example, if all the extra energy stored in the oceans was released to the atmosphere, the resulting temperature change in the atmosphere would be approximately 1000 times larger than the equivalent temperature change in the ocean.
While the absolute temperature changes over the whole ocean depth are small compared to those at the land and ocean surface, the ocean has taken up approximately 90 per cent of the extra energy from enhanced greenhouse gas concentrations. Oceans have therefore slowed the rate of warming near the Earth’s land and ocean surface. Heat absorbed at the surface is redistributed both horizontally and vertically by ocean circulation. As a result, the ocean is warming both near the surface and at depth, with the rate of warming varying between regions and depths.
The rate at which oceans are taking up heat has increased in recent decades. Over its full depth, the global ocean gained 35 x 1022 joules of additional heat from 1960 to 2019. Southern hemisphere oceans take up much of the extra heat. This is because the Southern Ocean circulation takes heat from near the surface and transfers it into the deep ocean. A warming ocean affects the global ocean and atmospheric circulation, global and regional sea levels, uptake of anthropogenic CO2, and causes losses in oxygen and impacts on marine ecosystems.
Long-term temperature trends in the deep ocean, below 2000 metres, show a slow but steady warming. However, there are currently far fewer observations below this depth compared to the upper ocean, so the magnitude of this warming is less certain.
Marine heatwaves and coral reefs
Warming oceans, together with an increase in the frequency, intensity and duration of marine heatwaves, pose a significant threat to the long-term health and resilience of coral reef ecosystems. Globally, large-scale mass coral bleaching events have occurred with increasing frequency and extent since the 1970s. Large‑scale bleaching is a stress response of corals that occurs primarily in response to elevated ocean temperature. As waters warm, the symbiotic relationship between coral and its zooxanthellae (single‑celled organisms that live within the corals) breaks down, eventually resulting in coral bleaching where the zooxanthellae are expelled. Without zooxanthellae, most corals struggle to survive. Recovery is possible, but mortality can occur if the thermal stress is too severe or prolonged.
Bleaching on the Great Barrier Reef has occurred with increased frequency in recent decades. Widespread bleaching occurred in 1998 and 2002, however over the last 10 years three mass coral bleaching events have occurred in 2016, 2017 and 2020. In 2016, bleaching was associated with some of the warmest sea surface temperatures ever recorded which, in turn, led to the largest recorded mass bleaching on the Great Barrier Reef. The impact of the mass bleaching in 2020 appears to be second only to 2016 and was associated with severely bleached coastal reefs along the entire 2300 km length of the Great Barrier Reef.
These three recent bleaching events are associated with marine heatwaves driven by anthropogenic climate change. Rapidly recurring bleaching events do not give the reef ecosystem time to recover from the damage caused by these events.
Climate models project more frequent, extensive, intense and longer-lasting marine heatwaves in the future. Coupled with a background warming of ocean temperatures, this implies more frequent and severe coral bleaching events are likely on the Great Barrier Reef and globally, leading to the potential loss of many types of coral throughout tropical reef systems worldwide. Along with ocean acidification and nutrient runoff, the increased severity and frequency of marine heatwaves are likely to reduce reef resilience and hinder coral recovery from future bleaching events.
Worsening impacts on coral reefs from marine heatwaves are expected in the future with continued warming but the intensification of marine heatwaves is much larger with higher global greenhouse gas emissions.
Sea level
- Global mean sea level has risen by around 25 cm since 1880; half of this rise has occurred since 1970.
- Rates of sea level rise vary across the Australian region, with the largest increases to the north and southeast of the Australian continent.
As the ocean warms it expands and sea level rises. This thermal expansion has contributed about one third of the sea level rise observed globally, around 25 cm since the late 19th century. Ice loss from glaciers and polar ice sheets, together with changes in the amount of water stored on the land, contribute the remaining two thirds of the observed global sea level rise. Ice loss from Greenland, Antarctica and glaciers has been the dominant contributor to global sea level rise from 1993 to the present.
Global mean sea level rise is accelerating. Tide gauge and satellite altimetry observations show that the rate of global mean sea level rise increased from 1.5 ± 0.2 cm per decade (1901–2000) to 3.5 ± 0.4 cm per decade (1993–2019). The dominant cause of global mean sea level rise since 1970 is anthropogenic climate change.
Confidence in assessing changes in mean global sea level has continuously improved because there has been more analysis of satellite altimetry and longer
records. Efforts to reliably quantify the various contributions to sea level rise have also led to greater confidence and process understanding.
Australia, like other nations, is already experiencing sea level rise. Sea level varies from year to year and from place to place, partly due to the natural variability of the climate system from the effect of climate drivers such as El Niño and La Niña. Based on satellite altimetry observations since 1993, the rates of sea level rise to the north and southeast of Australia have been significantly higher than the global average, whereas rates of sea level rise along the other coasts of the continent have been closer to the global average.
The long-term altimetry sea level record is typically restricted to the offshore region, beyond 25–50 km, while changes closer to Australia’s shoreline are estimated from tide gauge measurements at a limited number of locations. Local coastal processes, the effects of vertical land motion, and changes in site and/or reference levels affect local estimates of sea level change. For example, estimates from nearshore tide gauge measurements may differ from estimates derived from satellite altimetry tens of kilometres offshore. Nevertheless, tide gauges with good long-term records around Australia show overall changes in sea level rise consistent with offshore observations from satellite altimetry.
Rising sea levels pose a significant threat to coastal communities by amplifying the risks of coastal inundation, storm surge and erosion. Coastal communities in Australia are already experiencing some of these changes.
Ocean acidification
- The acidification of the oceans around Australia continues (pH is decreasing), and the impacts of these changes are detectable in areas such as the Great Barrier Reef.
Rising atmospheric CO2 levels increase the uptake of CO2 by the oceans, which affects their carbonate chemistry and decreases their pH; a process known as ocean acidification. In conjunction with other environmental changes, such as ocean warming and deoxygenation, ocean acidification brings additional pressures to the marine environment.
Impacts of ocean acidification to marine ecosystems include changes in reproduction, organism growth and physiology, species composition and distributions, food web structure, nutrient availability and reduced calcification rate. The last of these is particularly important for species that produce shells or skeletons of calcium carbonate, such as corals and shellfish.
Between 1880–1889 and 2010–2019, the average pH of surface waters around Australia is estimated to have decreased by about 0.12. This corresponds to a more than 30 per cent increase in acidity (and so the waters have become less alkaline). Due to latitudinal differences in ocean chemistry, the oceans to the south of Australia are acidifying faster than those to the north.
The rate of decrease in pH has accelerated to over 0.02 per decade, more than five times faster than from 1900 to 1960. This current rate of change is also 10 times faster than at any time in the past 300 million years. These changes have led to a significant reduction in coral calcification and growth rates on coral reefs such as the Great Barrier Reef, which affects their ability to recover from coral bleaching events.
Cryosphere
- The ice sheets and ice shelves of Antarctica and Greenland are losing ice and contributing to global sea level rise due to a warmer climate.
- The extent of sea ice in the Arctic has steadily reduced, while in the Antarctic there has been regional and seasonal variability in sea-ice cover.
The Earth’s ice sheets—glacial ice that has accumulated from precipitation over land—and ice shelves, which are floating sheets of ice formed from glacial ice sheets, play crucial roles in our global climate system. Ice shelves help stabilise the Antarctic ice sheet by restricting the flow of glacial ice from the continent to the ocean. Warm ocean water penetrating below the ice shelves of the West Antarctic ice sheet is destabilising several glaciers, increasing the Antarctic contribution to sea level rise. Atmospheric warming is also causing surface melting of ice sheets and ice shelves, particularly in Greenland and on the Antarctic Peninsula. From 2003 to 2019, melt from Greenland and Antarctica combined contributed around 1.4 cm of global sea level rise.
Changes in sea ice have little direct impact on sea level because sea ice is frozen sea water that floats. When it melts it returns the original volume of water to the sea. However, the presence or absence of sea ice influences the climate, including the rate of regional climate warming. Antarctic sea ice also acts as a protective buffer for ice shelves against destructive ocean swells. Changes in Antarctic sea-ice cover can also be an indicator of wider climate changes because it is an integrator of ocean, atmosphere and cryosphere components, from local change to the tropics.
Satellite monitoring of sea ice began in the late 1970s. Since then, Arctic sea‑ice cover has consistently decreased, whereas net sea-ice cover changes within the Antarctic have been mixed. Overall, Antarctic sea-ice extent showed a small increase from 1979 to 2014, but with substantial regional variations. The largest daily recorded wintertime extent of approximately 20.2 million km2 was in September 2014.
However, since then the sea‑ice cover has decreased to below the long-term average, with the lowest recorded daily summertime extent of approximately 2.1 million km2 occurring in 2017. The overall increase in Antarctic sea‑ice extent during 1979–2014 has mostly been attributed to changes in westerly wind strength, whereas the marked decrease from 2015 to 2017 was predominantly related to warming in the uppermost layers of the ocean.
Observed changes in Antarctic sea-ice cover are also regionally variable, as depicted in the trends of yearly sea‑ice duration. Statistically significant increases of up to two days per year in sea-ice duration have occurred in the Ross Sea, between 160° E and 150° W. Decreases in sea-ice duration of as much as four days per year are seen west of the Antarctic Peninsula and the Bellingshausen Sea offshore of West Antarctica. Recent sea-ice seasons (since 2015) have shown opposite regional responses to the long-term trend.
Changes in the Arctic sea-ice cover, since 1979, have been more seasonally and regionally uniform than those in the Antarctic, with decreasing trends in all months and virtually all regions. Sea-ice thickness in the Arctic has also decreased steadily over the last few decades, making it easier to break and melt in springtime.