The challenge
Australia’s environment contributes to our economy by providing clean water and air, fresh food, fibre, mineral resources, timber and a place for recreation. The environment also holds rich cultural and spiritual values fundamental to the Australian way of life. These contributions have not historically been included in Australian statistics on our productivity and wellbeing.
By bringing together environmental and economic information in accounts, the contributions the environment makes to the economy can be observed, quantified and understood. This ensures information about the environment is measured, presented and disclosed to inform diverse decision makers.
Our response
Our partnership of scientists, economists and accounting experts built on decades of international work to further develop accounting methods that tailor, extend, and bring together existing recognised techniques.
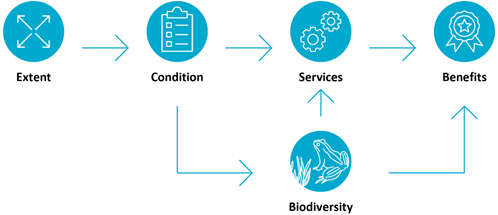 We focus on ecosystem accounts, specifically one type of environmental-economic accounts. These record the quantity (extent) and quality (condition) of ecosystems, as well as the biodiversity and ecosystem service(s) they support. Ecosystem services are the contributions of ecosystems to benefits – the goods and services that are ultimately used and enjoyed by people and society.
This project aimed to deliver experimental ecosystem accounts for the Murray-Darling Basin that:
- demonstrate the value of regional-scale ecosystem accounts for the Murray-Darling Basin Authority, who will analyse and interpret the information in outputs such as the Sustainable Rivers Audit
- contribute to the development of methods and frameworks to enable national-scale ecosystem accounting.
The project used input data from a wide variety of authoritative sources, and delivered account-ready data so that end users can compile their own accounts.
This project was funded by the Australian Government Department of Climate Change, Energy, the Environment and Water (DCCEEW) as part of the Environmental Economic Accounting: A common national approach – Strategy and Action Plan. This plan was established in 2018 when Commonwealth, state and territory governments agreed to apply the United Nation's System of Environmental-Economic Accounting (SEEA) across Australia to account for environmental assets such as land, oceans and ecosystems.
Download the outputs:
The following outputs span all accounting components: ecosystem extent, ecosystem condition, biodiversity and ecosystem services. Subsequent sections provide links to account-ready data for each of these accounting components individually.
- Synthesis for government policy officers and program managers
- Short summary for the public
- Data collection of all experimental ecosystem accounts and supplementary data, including methods
- Summary of data sources
Account-ready data: Extent and condition of ecosystems
Ecosystem extent is the size (area) of ecosystem assets, classified by ecosystem types. Ecosystem condition is the quality of an ecosystem in terms of its integrity – the ability to maintain its characteristic composition, structure and function over time.
Download the account-ready data:
- Data collection: ecosystem extent, including methods
- Data collection: ecosystem site condition, including methods
Account-ready data: Biodiversity
Biodiversity is the variability among living organisms. We assessed biodiversity at both community and species levels:
- community: vascular plants (shown), reptiles, birds, waterbirds
- species: habitat for nationally listed threatened species (shown), river red gum, lignum, royal spoonbill, straw-necked ibis
Download the account-ready data:
- Data collection: biodiversity, including methods
Account-ready data: Ecosystem services
 Ecosystem services are the contributions of ecosystems to benefits – the goods and services that are ultimately used and enjoyed by people and society. Ecosystem service accounts can be compiled in both physical and monetary terms. We assessed the following services:
- terrestrial carbon storage, sequestration and emissions
- provision of recreational fishing opportunities
- water provisioning and sediment retention
- crop and grazed biomass provisioning
Download the outputs:
- Data collection: ecosystem services, including methods
Next steps
These methods to develop this integrated system of information for ecosystems can be applied for all modified and unmodified ecosystems across Australia, including urban and agricultural ecosystems. The datasets produced as part of this project can give valuable insights to decision makers and communities about changes in the Murray-Darling Basin. These datasets can be accessed in full at the links above.
This work will also inform future ecosystem accounts, helping ensure that accounts are ecologically meaningful and supported by enduring and trusted environmental data.
Find out more at the Australian Government Environmental-Economic Accounting (EEA) website
The challenge
Australia’s environment contributes to our economy by providing clean water and air, fresh food, fibre, mineral resources, timber and a place for recreation. The environment also holds rich cultural and spiritual values fundamental to the Australian way of life. These contributions have not historically been included in Australian statistics on our productivity and wellbeing.
By bringing together environmental and economic information in accounts, the contributions the environment makes to the economy can be observed, quantified and understood. This ensures information about the environment is measured, presented and disclosed to inform diverse decision makers.
Our response
Our partnership of scientists, economists and accounting experts built on decades of international work to further develop accounting methods that tailor, extend, and bring together existing recognised techniques.
We focus on ecosystem accounts, specifically one type of environmental-economic accounts. These record the quantity (extent) and quality (condition) of ecosystems, as well as the biodiversity and ecosystem service(s) they support. Ecosystem services are the contributions of ecosystems to benefits – the goods and services that are ultimately used and enjoyed by people and society.
This project aimed to deliver experimental ecosystem accounts for the Murray-Darling Basin that:
- demonstrate the value of regional-scale ecosystem accounts for the Murray-Darling Basin Authority, who will analyse and interpret the information in outputs such as the Sustainable Rivers Audit
- contribute to the development of methods and frameworks to enable national-scale ecosystem accounting.
The project used input data from a wide variety of authoritative sources, and delivered account-ready data so that end users can compile their own accounts.
This project was funded by the Australian Government Department of Climate Change, Energy, the Environment and Water (DCCEEW) as part of the Environmental Economic Accounting: A common national approach – Strategy and Action Plan. This plan was established in 2018 when Commonwealth, state and territory governments agreed to apply the United Nation's System of Environmental-Economic Accounting (SEEA) across Australia to account for environmental assets such as land, oceans and ecosystems.
Download the outputs:
The following outputs span all accounting components: ecosystem extent, ecosystem condition, biodiversity and ecosystem services. Subsequent sections provide links to account-ready data for each of these accounting components individually.
- Synthesis for government policy officers and program managers
- Short summary for the public
- Data collection of all experimental ecosystem accounts and supplementary data, including methods
- Summary of data sources
Account-ready data: Extent and condition of ecosystems
Ecosystem extent is the size (area) of ecosystem assets, classified by ecosystem types. Ecosystem condition is the quality of an ecosystem in terms of its integrity – the ability to maintain its characteristic composition, structure and function over time.
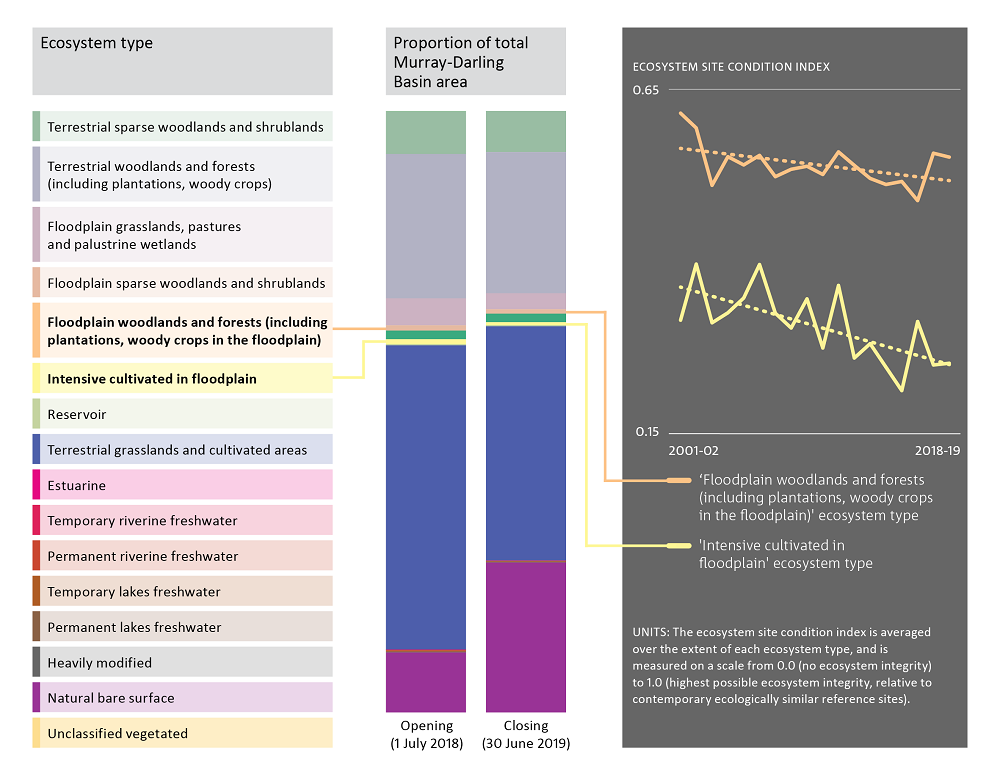
Extent and condition of ecosystems.
Graph 1: A list of ecosystem types in the Murray-Darling Basin. Graph 2: The stacked bar charts show the proportion of the total Murray-Darling Basin that each ecosystem type occupies for the opening and closing dates of the 2018-19 account. The largest extent is the blue 'terrestrial grasslands and cultivated areas' type. Graph 3: A history of the condition for two example ecosystem types, reported as an index between 0 and 1, where 1 is the highest possible condition.
Download the account-ready data:
- Data collection: ecosystem extent, including methods
- Data collection: ecosystem site condition, including methods
Account-ready data: Biodiversity
Biodiversity is the variability among living organisms. We assessed biodiversity at both community and species levels:
- community: vascular plants (shown), reptiles, birds, waterbirds
- species: habitat for nationally listed threatened species (shown), river red gum, lignum, royal spoonbill, straw-necked ibis
Download the account-ready data:
- Data collection: biodiversity, including methods
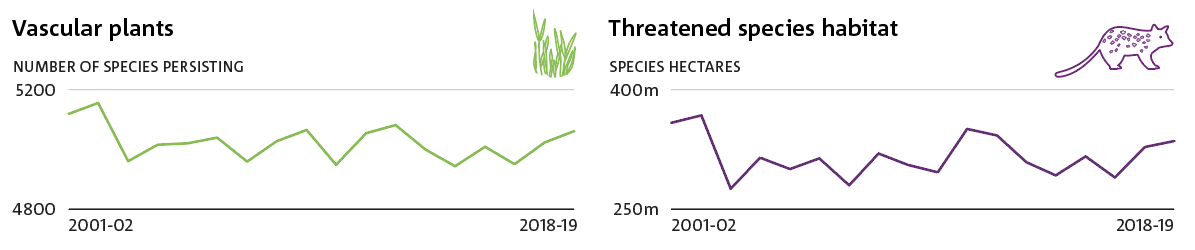
Vascular plants: The number of originally occurring (pre-European) vascular plant species that are expected to persist, for each financial year from 2001-02 to 2018-19. Threatened species habitat: The amount of habitat for threatened species, for each financial year from 2001-02 to 2018-19. ‘Species hectares’ (in millions of hectares) is the number of species multiplied by the area of effective habitat.
Account-ready data: Ecosystem services
Ecosystem services are the contributions of ecosystems to benefits – the goods and services that are ultimately used and enjoyed by people and society. Ecosystem service accounts can be compiled in both physical and monetary terms. We assessed the following services:
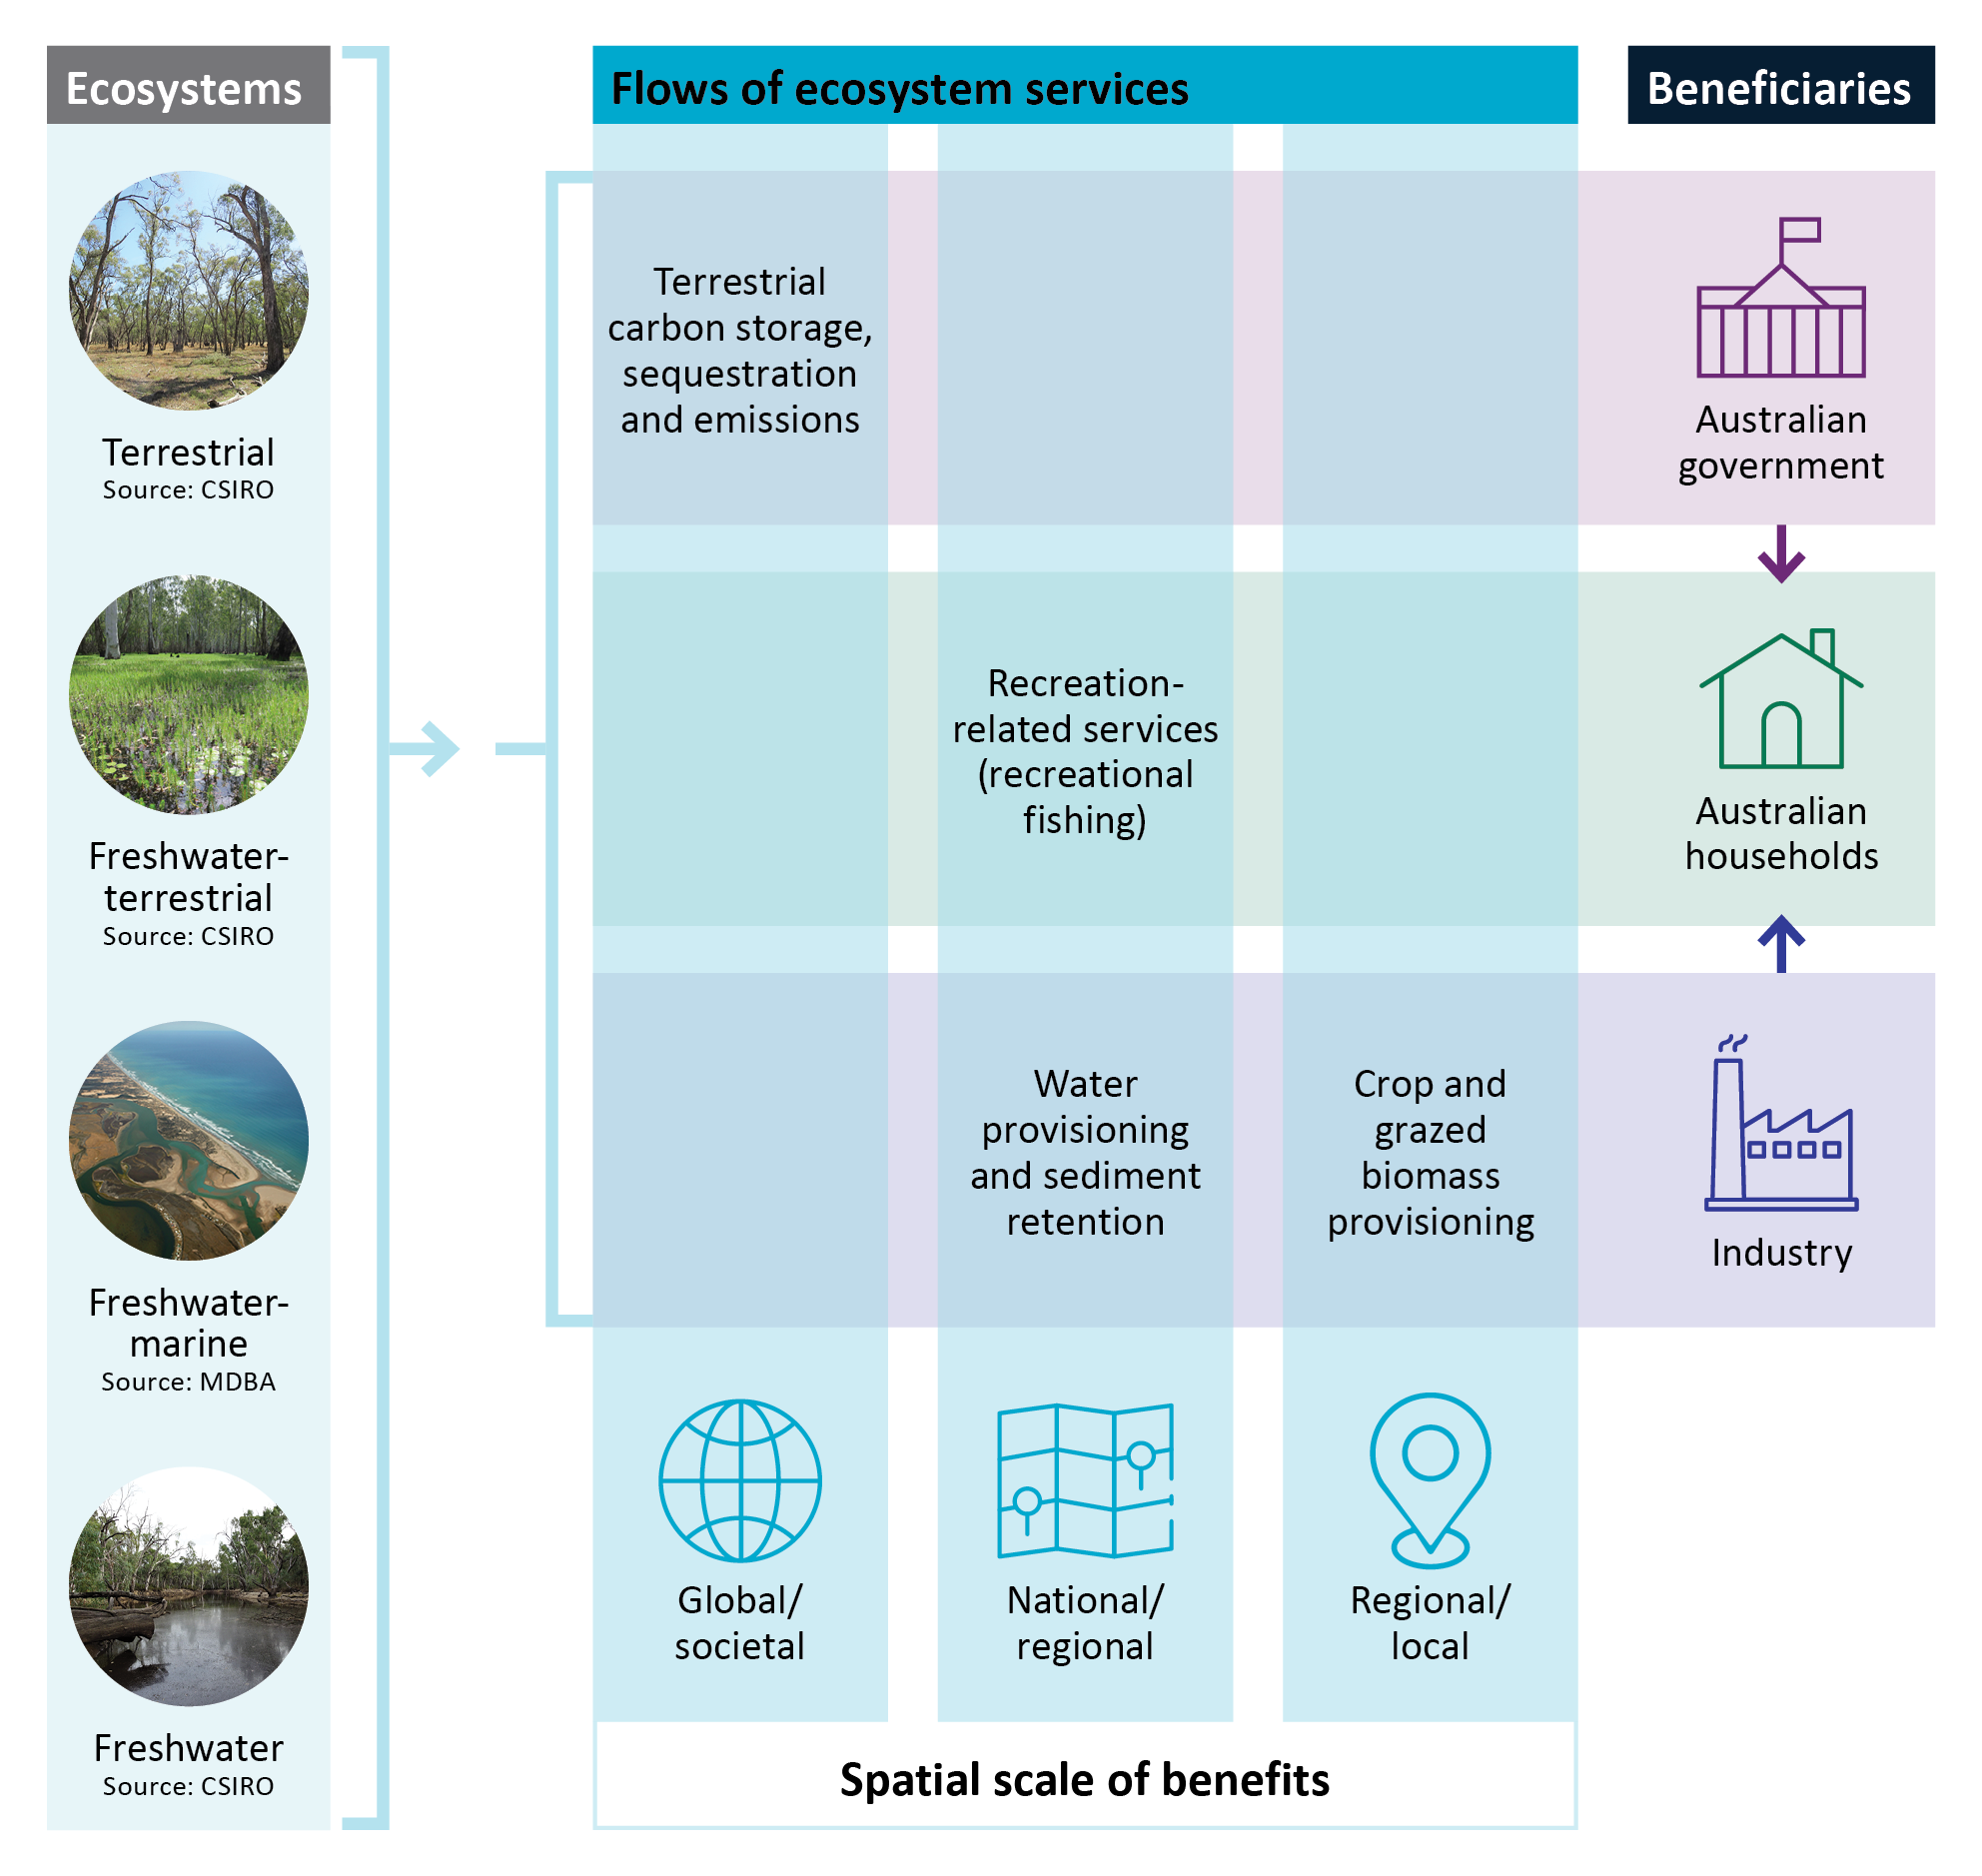
Ecosystems, flows of ecosystem services, and beneficiaries assessed in this project .
- terrestrial carbon storage, sequestration and emissions
- provision of recreational fishing opportunities
- water provisioning and sediment retention
- crop and grazed biomass provisioning
Download the outputs:
- Data collection: ecosystem services, including methods
Next steps
These methods to develop this integrated system of information for ecosystems can be applied for all modified and unmodified ecosystems across Australia, including urban and agricultural ecosystems. The datasets produced as part of this project can give valuable insights to decision makers and communities about changes in the Murray-Darling Basin. These datasets can be accessed in full at the links above.
This work will also inform future ecosystem accounts, helping ensure that accounts are ecologically meaningful and supported by enduring and trusted environmental data.
Find out more at the Australian Government Environmental-Economic Accounting (EEA) website
Related to this page
- An Ecological Knowledge System to support nature repair in Australia
- The Natural Capital Handbook – a practical guide to corporate natural capital accounting, impact, dependency and risk/opportunity assessment; and reporting
- Experimental ecosystem accounts for the Gunbower-Koondrook-Perricoota Forest Icon site