The Bioclimatic Ecosystem Resilience Index (BERI) assesses the capacity of natural ecosystems to retain biodiversity in the face of climate change.
Its outputs are influenced by ecosystem condition and connectivity, spatial variation in present-day species composition, and expected shifts in species composition under climate change.
BERI is recognised as a component indicator for reporting progress in achieving Target 8 of the Kunming-Montreal Global Biodiversity Framework (KM-GBF).
The BERI approach
BERI is derived from two main inputs:
- A high-resolution map of the current condition of terrestrial ecosystems.
- Maps describing spatial variation in species composition under current and future climates.
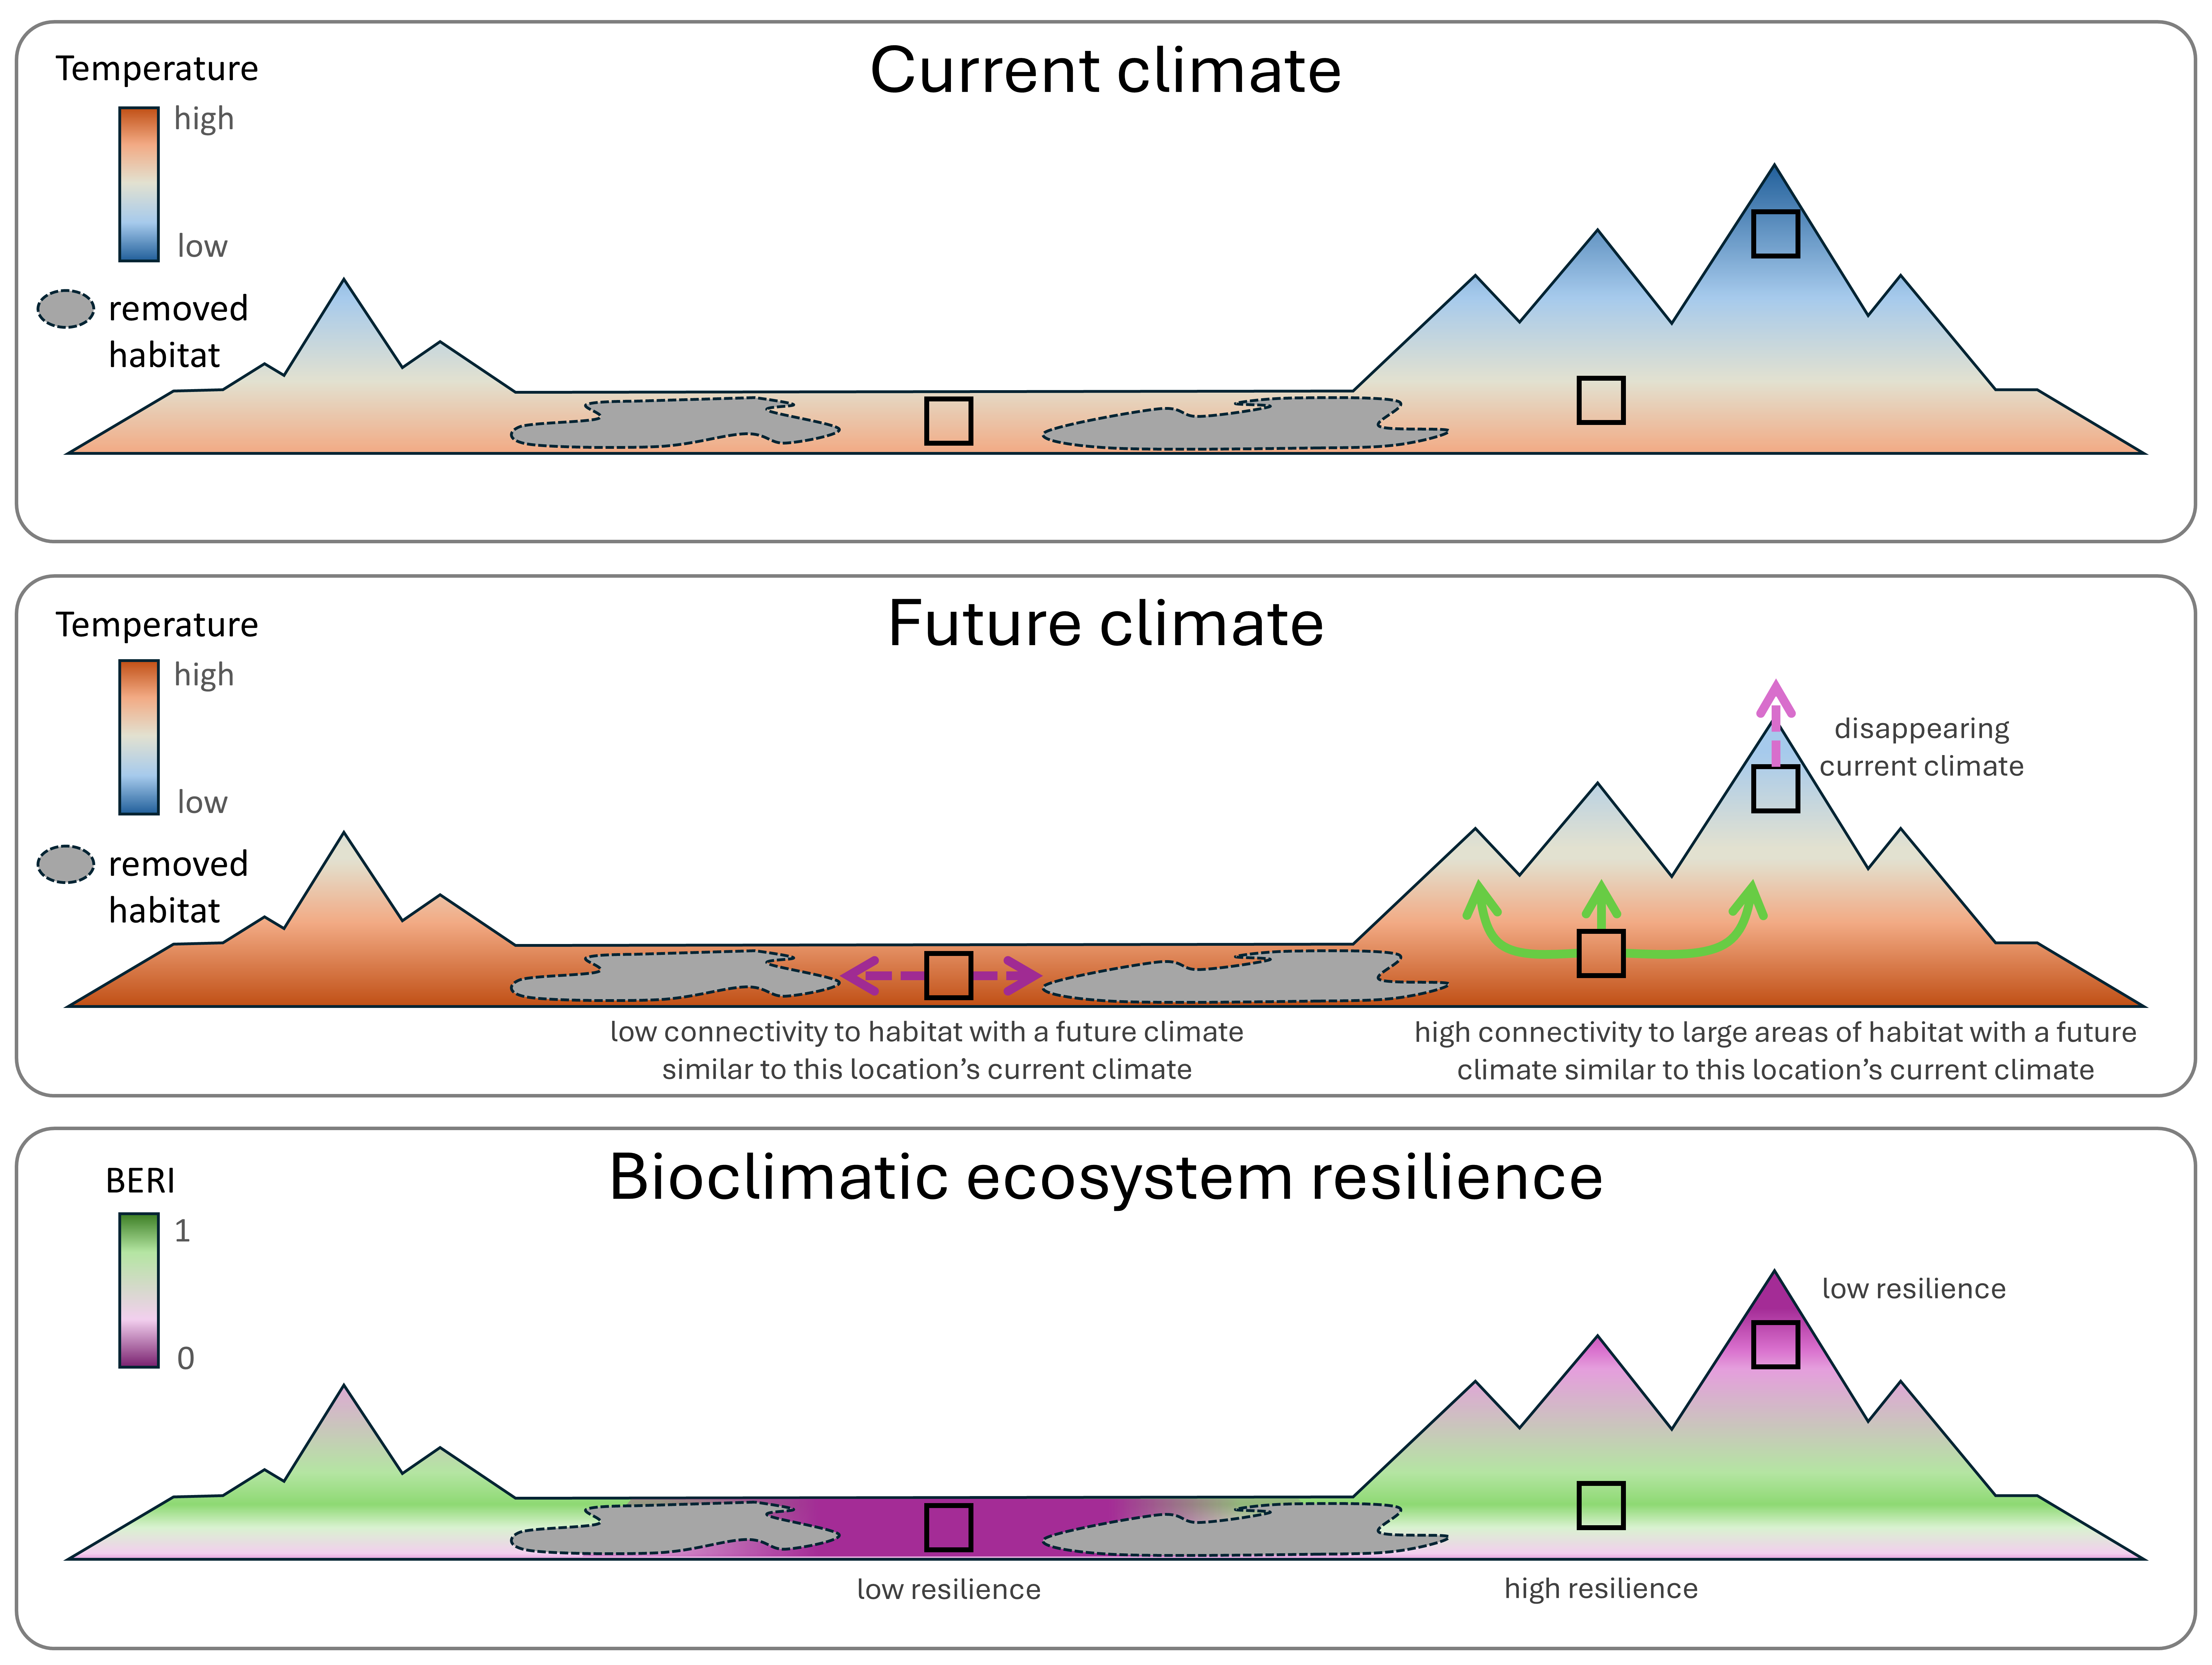
BERI assesses how well each location is connected to nearby habitats that are likely to support a similar assemblage of species in future, based on projected climate change. It also accounts for how human changes to natural habitat impact this connectivity.
The BERI value for any given location represents the proportion (from 0 to 1) of connected habitat expected to remain under climate change, compared to the amount that would exist without climate change and human modification of natural habitat.
Calculating BERI
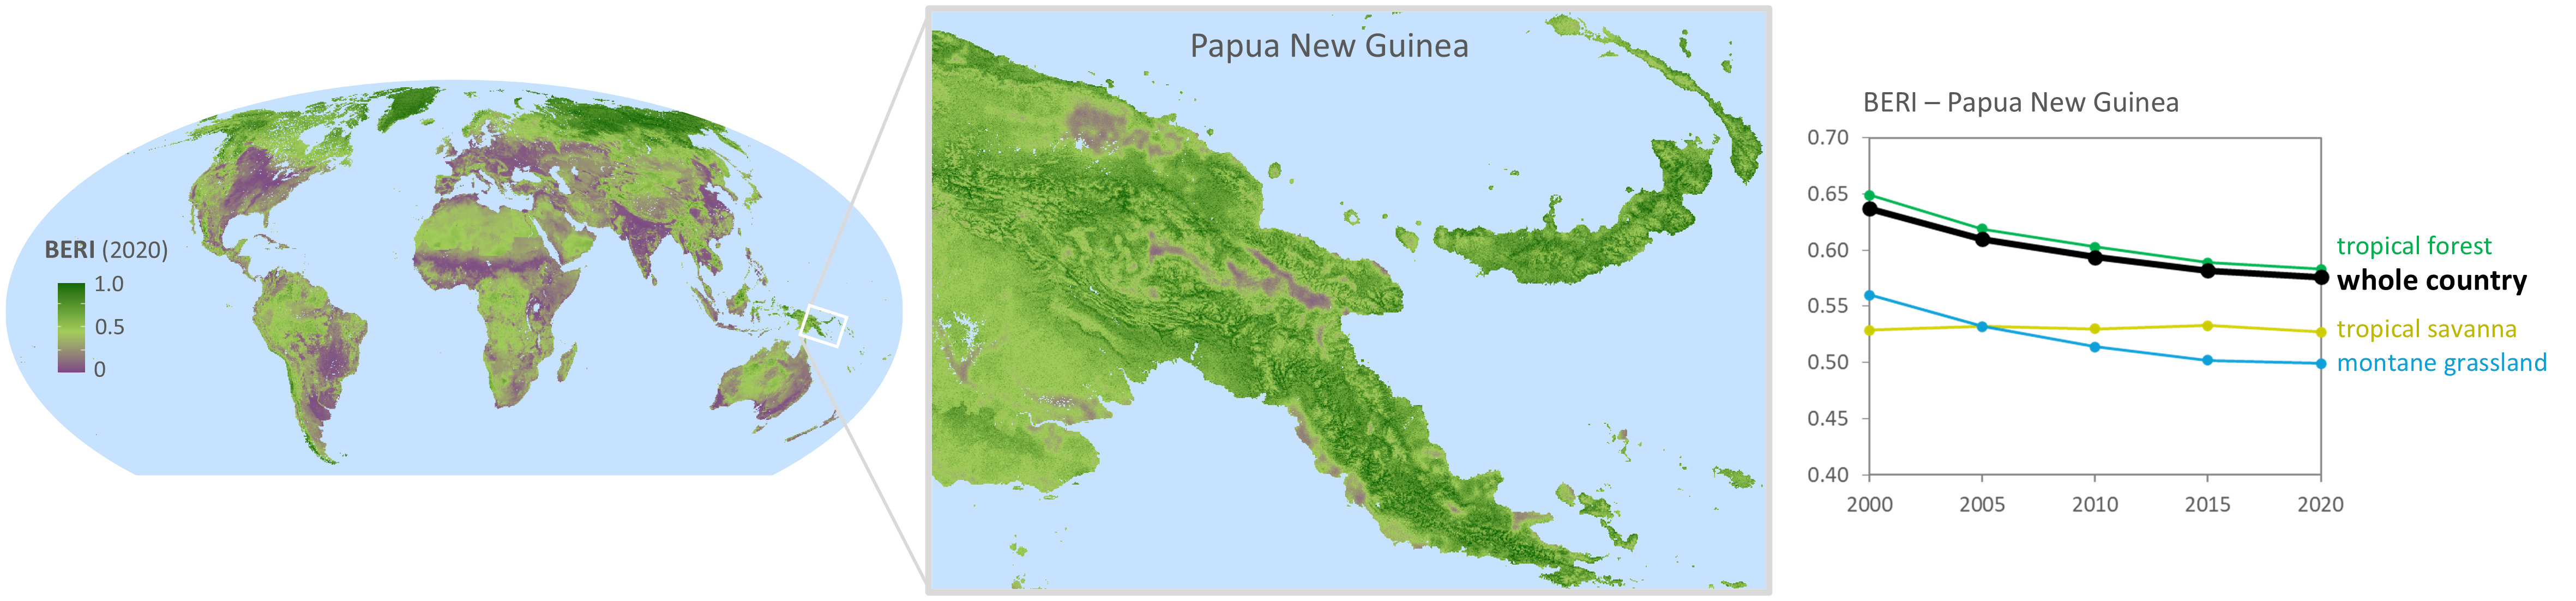
Our researchers have calculated BERI across all land in the world (excluding Antarctica) at ≈1 km spatial resolution. Our models are based on data for more than 400,000 species of plants, vertebrates and invertebrates. These global results can be viewed and summarised for any region or country worldwide.
BERI can also be calculated at a finer spatial resolution for any region or country of particular interest, using best-available regional or national data inputs.
Using BERI
The primary output of a BERI analysis is a map showing the BERI value for every location in a given year, derived from ecosystem-condition mapping for that year. This map can be used to calculate an overall BERI value for any reporting region, such as a country, a district, or an ecosystem type.
BERI can be used to:
- Report changes in expected resilience to climate change, resulting from observed changes in ecosystem condition and connectivity.
- Further report expected resilience relative to the maximum resilience achievable through adaptation alone (i.e. through ecosystem protection and restoration) as opposed to that achievable only through climate mitigation.
- Identify areas where biodiversity may be particularly vulnerable to impacts of climate change.
- Identify which areas are best to protect or restore, in order to enhance the resilience of ecosystems to climate change.
Accessing BERI
Global BERI data at ≈1 km spatial resolution can be downloaded from our Data Access Portal, or viewed in map form on the UN Biodiversity Lab.
You can explore BERI summaries and interactive maps for each country over on our global biodiversity indicator explorer.
These data services currently provide BERI results up to 2020, but our researchers will soon be adding annual results through to 2024.
BERI can now also be derived based on customised data inputs for any particular region or country using BILBI Live – our biodiversity indicator API service.
Find out more
A comprehensive overview of the global implementation of BERI is provided in the KM-GBF metadata factsheet.
Further technical details of the methods used to calculate and apply BERI are provided in the following scientific papers:
- A globally applicable indicator of the capacity of terrestrial ecosystems to retain biological diversity under climate change: The bioclimatic ecosystem resilience index
- Staying connected: assessing the capacity of landscapes to retain biodiversity in a changing climate
You can also reach out to the CSIRO team who developed BERI via email: bilbi-indicators@csiro.au
The Bioclimatic Ecosystem Resilience Index (BERI) assesses the capacity of natural ecosystems to retain biodiversity in the face of climate change.
Its outputs are influenced by ecosystem condition and connectivity, spatial variation in present-day species composition, and expected shifts in species composition under climate change.
BERI is recognised as a component indicator for reporting progress in achieving Target 8 of the Kunming-Montreal Global Biodiversity Framework (KM-GBF).
The BERI approach
BERI is derived from two main inputs:
- A high-resolution map of the current condition of terrestrial ecosystems.
- Maps describing spatial variation in species composition under current and future climates.
BERI assesses how well each location is connected to nearby habitats that are likely to support a similar assemblage of species in future, based on projected climate change. It also accounts for how human changes to natural habitat impact this connectivity.
The BERI value for any given location represents the proportion (from 0 to 1) of connected habitat expected to remain under climate change, compared to the amount that would exist without climate change and human modification of natural habitat.
Calculating BERI
Our researchers have calculated BERI across all land in the world (excluding Antarctica) at ≈1 km spatial resolution. Our models are based on data for more than 400,000 species of plants, vertebrates and invertebrates. These global results can be viewed and summarised for any region or country worldwide.
BERI can also be calculated at a finer spatial resolution for any region or country of particular interest, using best-available regional or national data inputs.
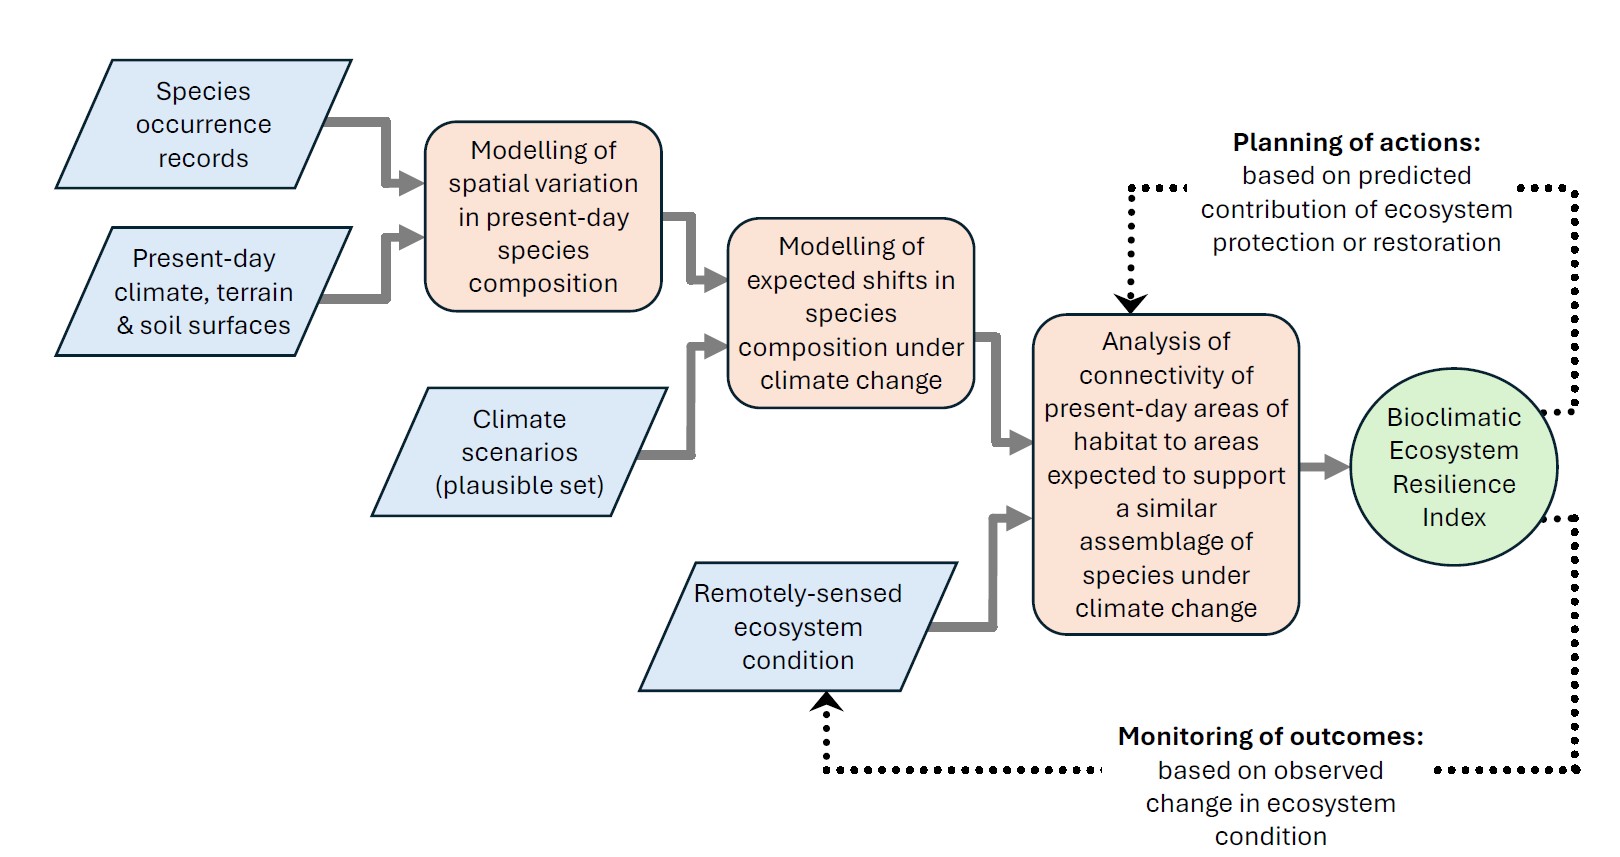
This flowchart shows a process beginning with two inputs: species occurrence records and present-day climate, terrain and soil surfaces. These feed into modelling of spatial variation in present-day species composition. This, together with a plausible set of climate scenarios, feed into the modelling of expected shifts in species composition under climate change. This, together with remotely-sensed ecosystem condition, feeds into an analysis of connectivity of present-day areas of habitat to areas expected to support a similar assemblage of species under climate change. This analysis is what results in the Bioclimatic Ecosystem Resilience Index, or BERI. BERI can then be used for the planning of actions based on predicted contributions of ecosystem protection or restoration, which doubles back to inform the analysis of connectivity of present-day areas of habitat to areas expected to support a similar assemblage of species under climate change. BERI can also be used for monitoring outcomes based on observed changes in ecosystem condition. This then feeds back into remotely-sensed ecosystem condition The flowchart represents a feedback loop for evaluating and enhancing ecosystem resilience in response to climate change.
Using BERI
The primary output of a BERI analysis is a map showing the BERI value for every location in a given year, derived from ecosystem-condition mapping for that year. This map can be used to calculate an overall BERI value for any reporting region, such as a country, a district, or an ecosystem type.
BERI can be used to:
- Report changes in expected resilience to climate change, resulting from observed changes in ecosystem condition and connectivity.
- Further report expected resilience relative to the maximum resilience achievable through adaptation alone (i.e. through ecosystem protection and restoration) as opposed to that achievable only through climate mitigation.
- Identify areas where biodiversity may be particularly vulnerable to impacts of climate change.
- Identify which areas are best to protect or restore, in order to enhance the resilience of ecosystems to climate change.
Accessing BERI
Global BERI data at ≈1 km spatial resolution can be downloaded from our Data Access Portal, or viewed in map form on the UN Biodiversity Lab.
You can explore BERI summaries and interactive maps for each country over on our global biodiversity indicator explorer.
These data services currently provide BERI results up to 2020, but our researchers will soon be adding annual results through to 2024.
BERI can now also be derived based on customised data inputs for any particular region or country using BILBI Live – our biodiversity indicator API service.
Find out more
A comprehensive overview of the global implementation of BERI is provided in the KM-GBF metadata factsheet.
Further technical details of the methods used to calculate and apply BERI are provided in the following scientific papers:
- A globally applicable indicator of the capacity of terrestrial ecosystems to retain biological diversity under climate change: The bioclimatic ecosystem resilience index
- Staying connected: assessing the capacity of landscapes to retain biodiversity in a changing climate
You can also reach out to the CSIRO team who developed BERI via email: bilbi-indicators@csiro.au