Temperature
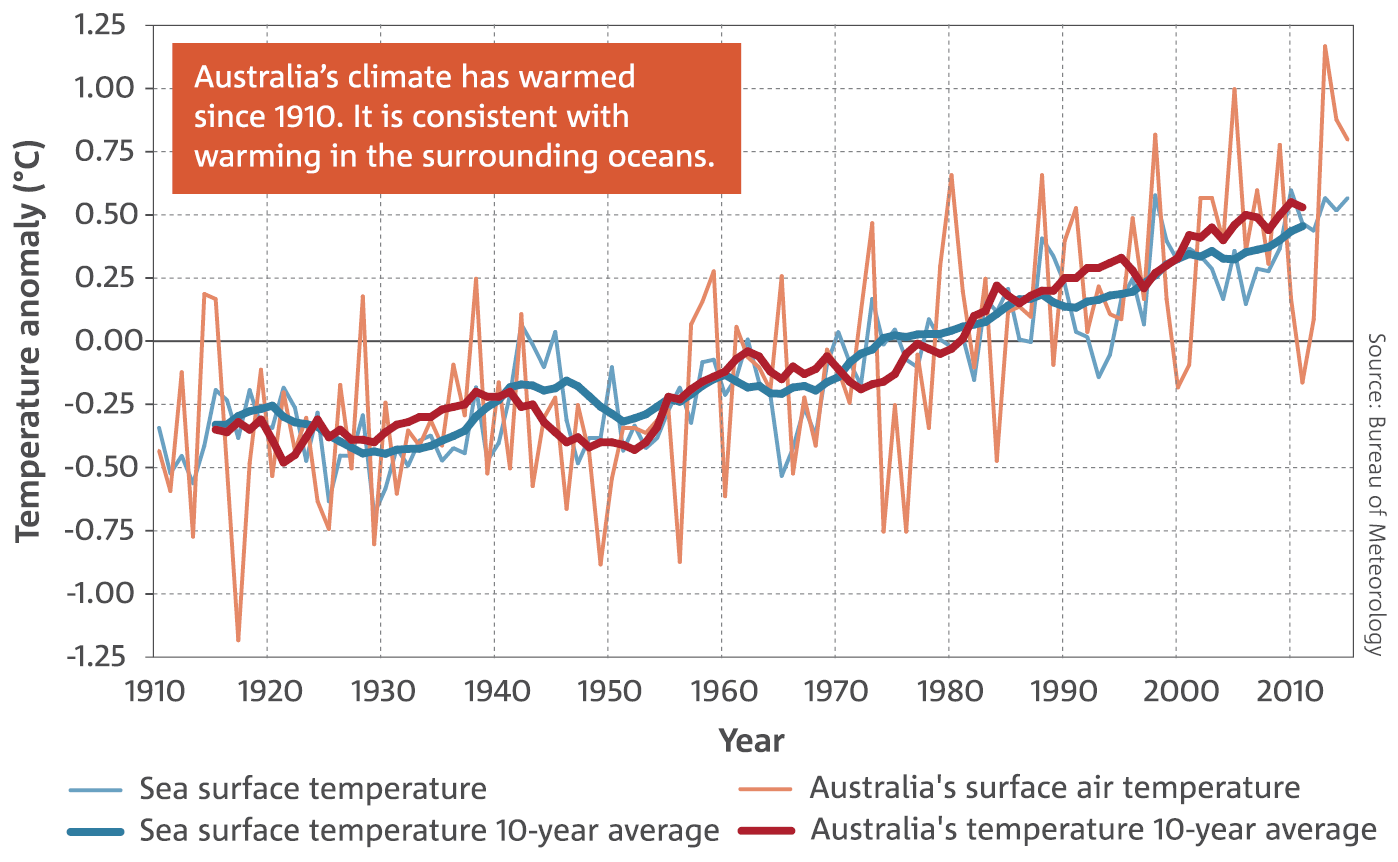
Australia’s weather and climate are changing in response to a warming global climate system. Australia has warmed by around 1 °C since 1910, with most warming since 1950. Australia’s top five warmest years on record included each of the last three years—2013, 2014 and 2015; 2013 was Australia’s warmest year on record. The warming trend occurs against a background of year-to-year climate variability, mostly associated with El Niño and La Niña in the tropical Pacific Ocean.
Sea surface temperatures in the Australian region have warmed by nearly 1 °C since 1900, with the past three years, 2013–2015, all in the region’s five warmest years on record.
The shift to a warmer climate in Australia is accompanied by more extreme heat events on daily, multi-day and seasonal timescales.
Australia-wide, increases in average temperature have been more notable across autumn, winter and spring, with the smallest trends in summer. The last three years (2013, 2014, and 2015) have seen the warmest spring seasons on record. Recent attribution studies reveal that the underlying global warming trend was important in driving the unusually warm temperatures experienced during those three spring seasons.
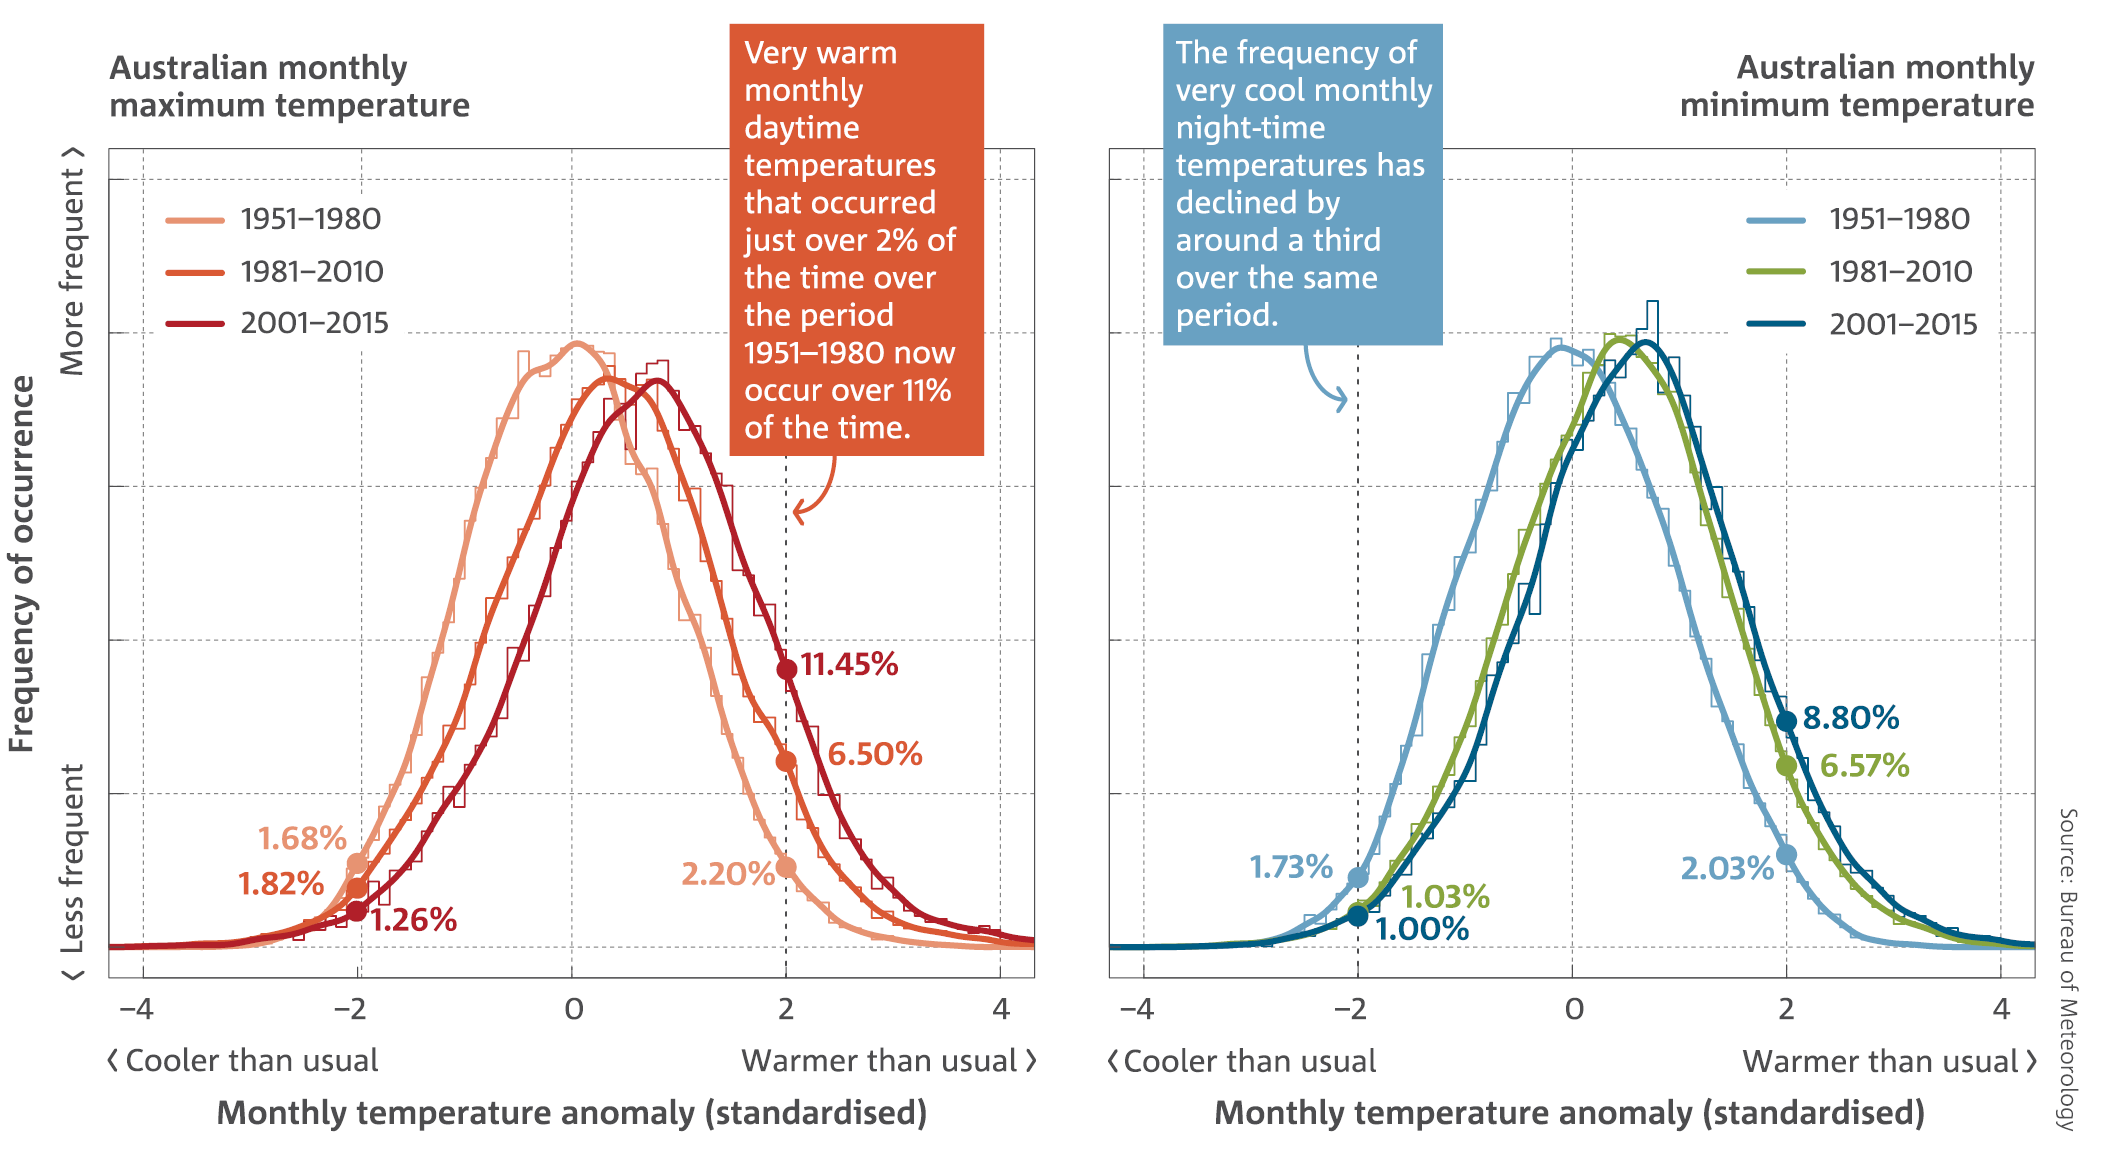
Across Australia, the increases in averaged monthly maximum and minimum temperatures have shifted the temperature distribution, and led to an increase in warm extremes. Very warm monthly maximum temperatures that occurred around 2 per cent of the time during the period 1951–1980 occurred over 11 per cent of the time during the period 2001–2015. Very warm monthly minimum, or night-time, temperatures that occurred 2 per cent of the time in the 1951–1980 period now occur nearly 9 per cent of the time. Examining the temperature distribution shifts in this way can assist in detecting changes in the climate system.
Determining the cause of extreme weather events
As the global climate system has warmed, changes have occurred to both the frequency and severity of extreme weather. In Australia, the most obvious change has been an increase in the occurrence of record-breaking heat. Quantifying the influence of increasing atmospheric greenhouse gases on extreme weather events is an important component of communicating and planning for future climate change.
A growing amount of research, including published work from the Bureau of Meteorology and CSIRO, estimates the relative contributions of natural variability and climate change to individual extreme events. These studies use statistical modelling, dynamical climate modelling and weather forecasting techniques.
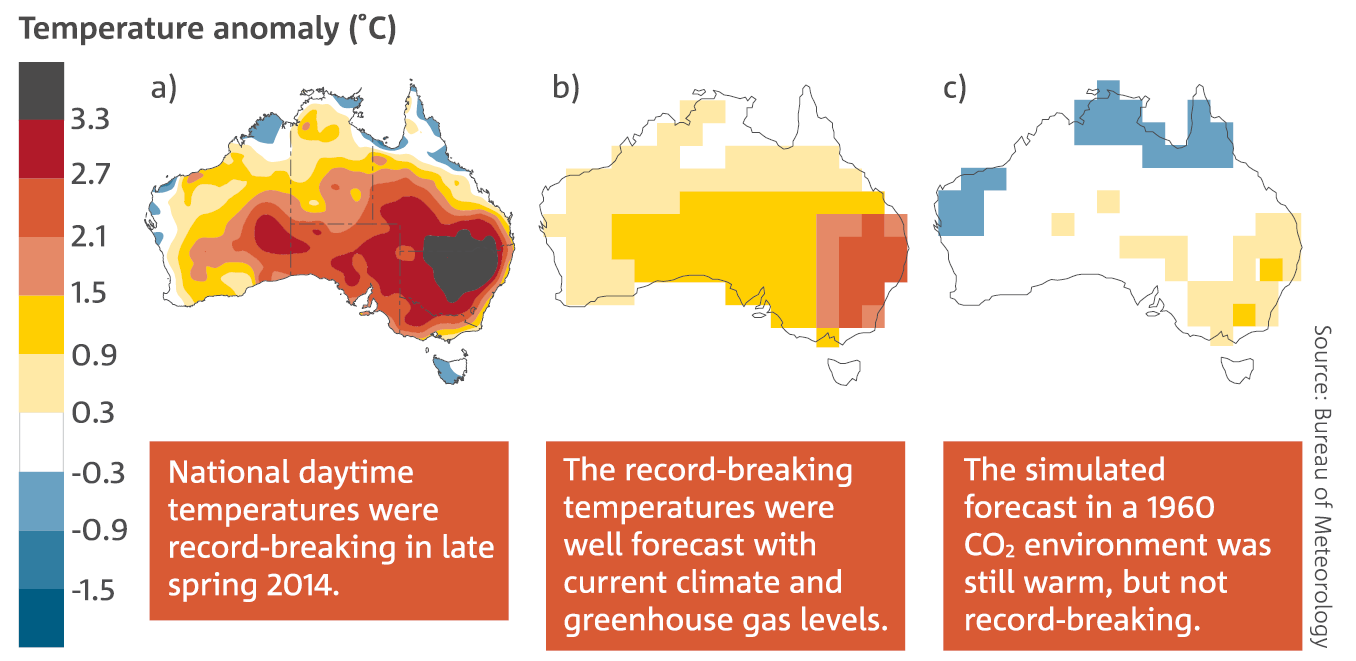
For example, in 2014, Australia experienced daytime temperatures during October–November that were a record 2.47 °C above the 1961–1990 mean. Our research shows that the same weather systems in a lower CO2 environment, typical of 1960, would have been warm over the southeast, but not record-breaking. Similarly, a Bureau of Meteorology study of Australia’s record-breaking temperatures of September 2013 found that about 15 per cent of the record temperature anomaly can be explained by global warming.
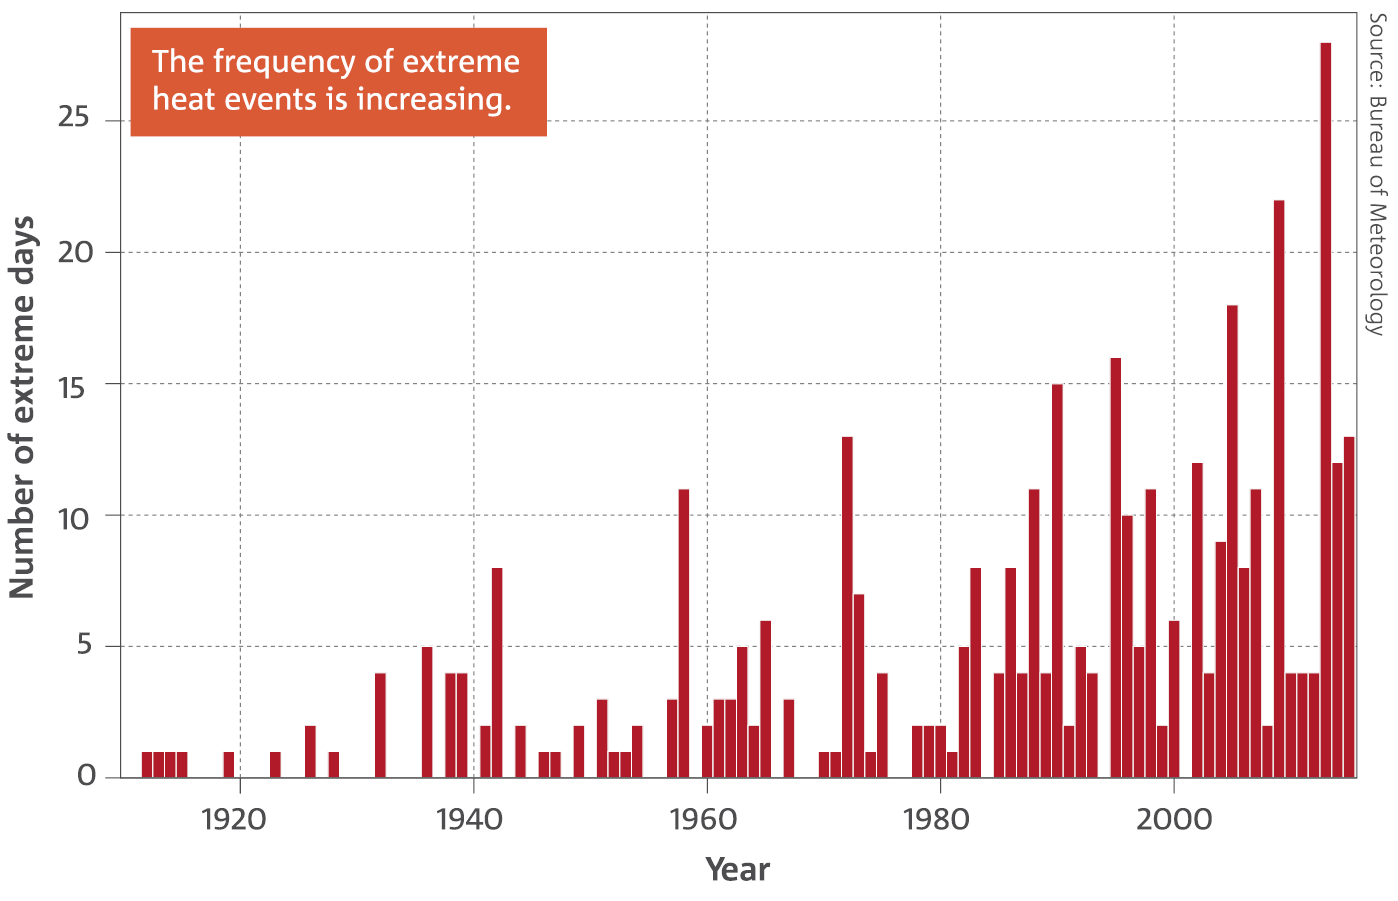
Extreme temperature events that occur over large areas of the continent are also increasing in frequency. This is illustrated by an increase in the number of days per year when the Australian area-averaged daily mean temperature is extreme. In this instance, extreme days are defined as those above the 99th percentile of each month from the years 1910–2015. In 2013 there were 28 days over this threshold. This compares to the period prior to 1950 when more than half the years had no extreme days.
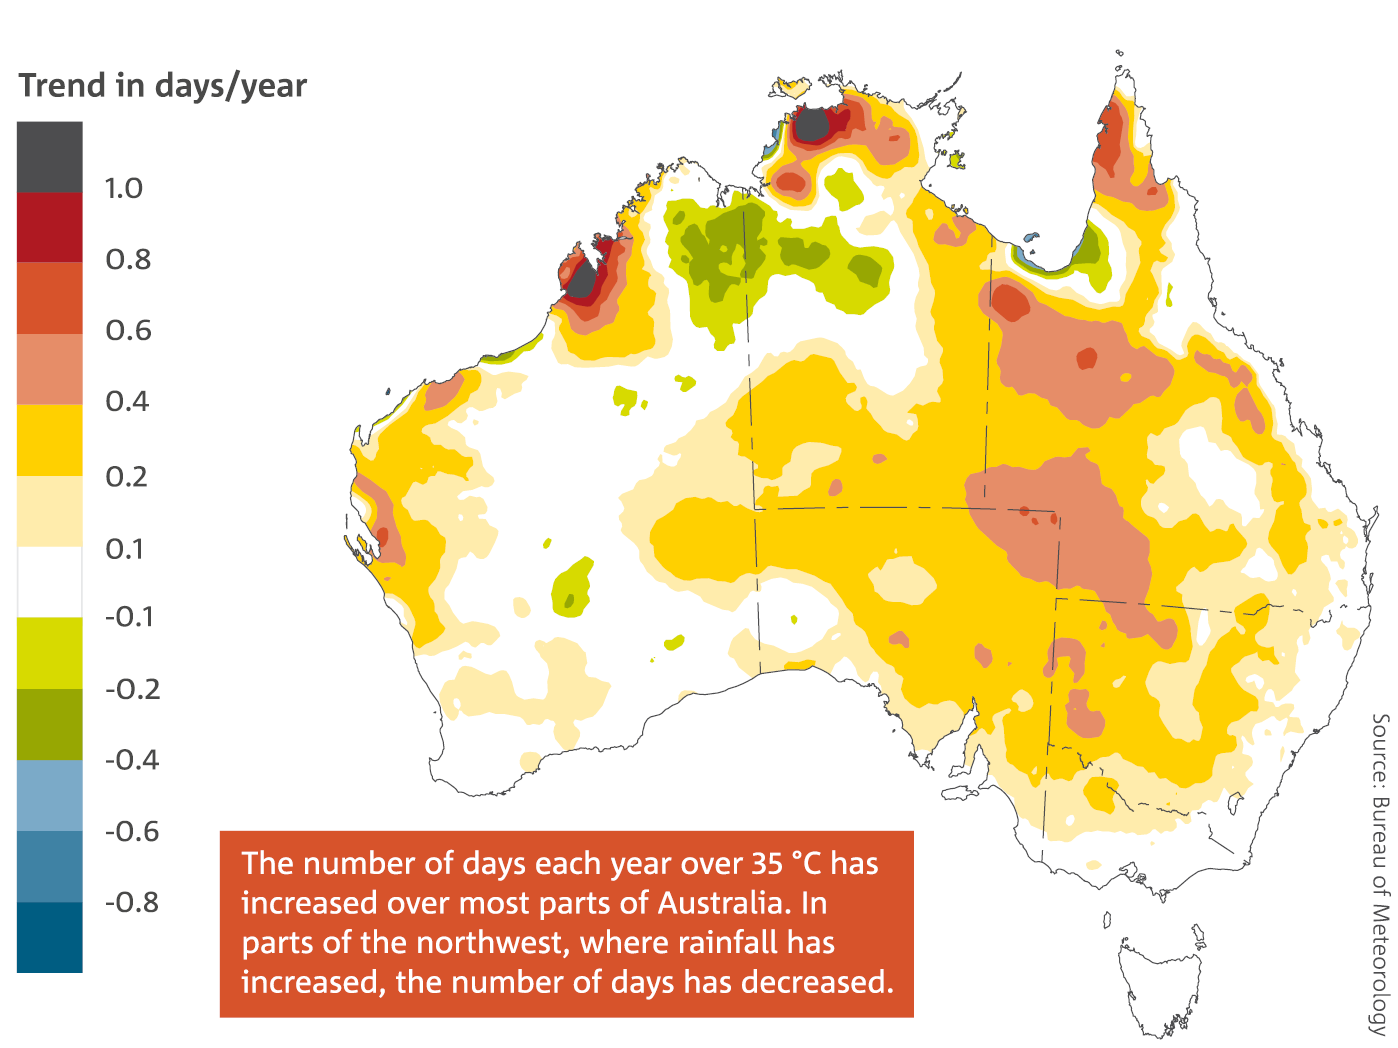
The number of days per year with maximum temperatures greater than 35 °C varies across Australia. In some parts of northern Australia there can be years with more than 150 days warmer than 35 °C. In areas of southern Australia, such as Tasmania, on average fewer than 15 days are warmer than 35 °C. The number of these hot days per year has increased over most parts of Australia. In parts of the northwest, where rainfall has increased, the number of hot days has decreased.
Fire weather
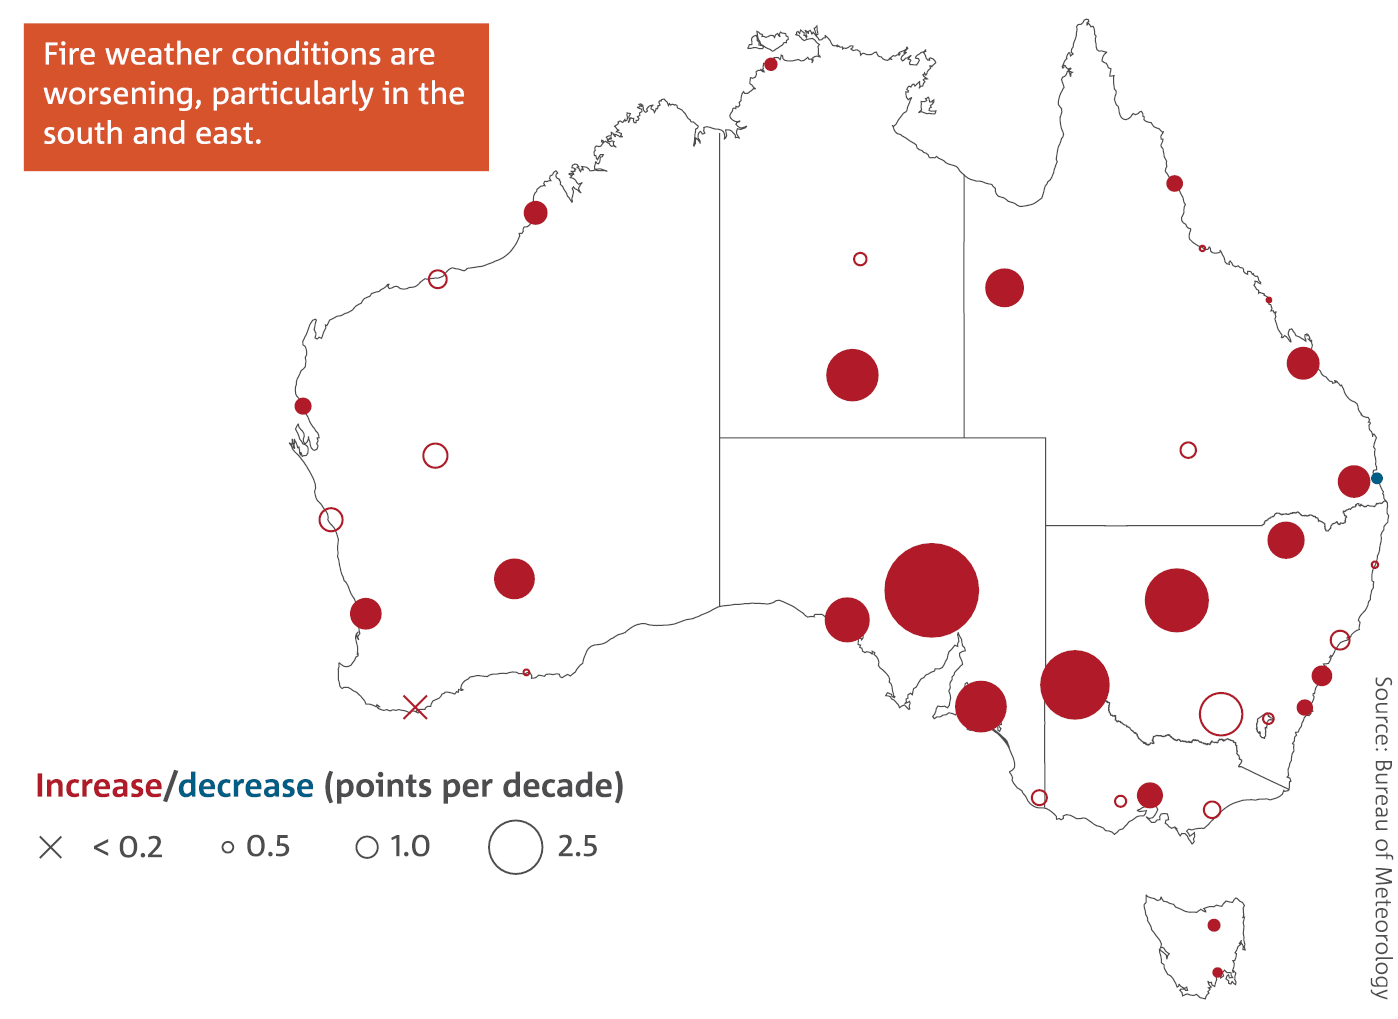
Fire weather is monitored in Australia with the Forest Fire Danger Index (FFDI). This helps estimate the fire danger on a given day based on observations of temperature, humidity, wind speed and rainfall. The annual 90th percentile of daily FFDI points has increased since 1974 across Australia, especially in southern and eastern Australia, and the fire season has lengthened. Increasing temperatures and drying contributed to the observed upward trend in FFDI. Considerable year-to-year variability is also seen, with La Niña years (e.g. 2010–11 and 1999–2000) generally associated with a lower frequency of days with high values of FFDI.
Rainfall
Australian rainfall varies greatly from one year to the next and from one decade to the next, and is strongly influenced by phenomena such as El Niño and La Niña. Despite this large natural variability, underlying longer-term trends are evident in some regions.
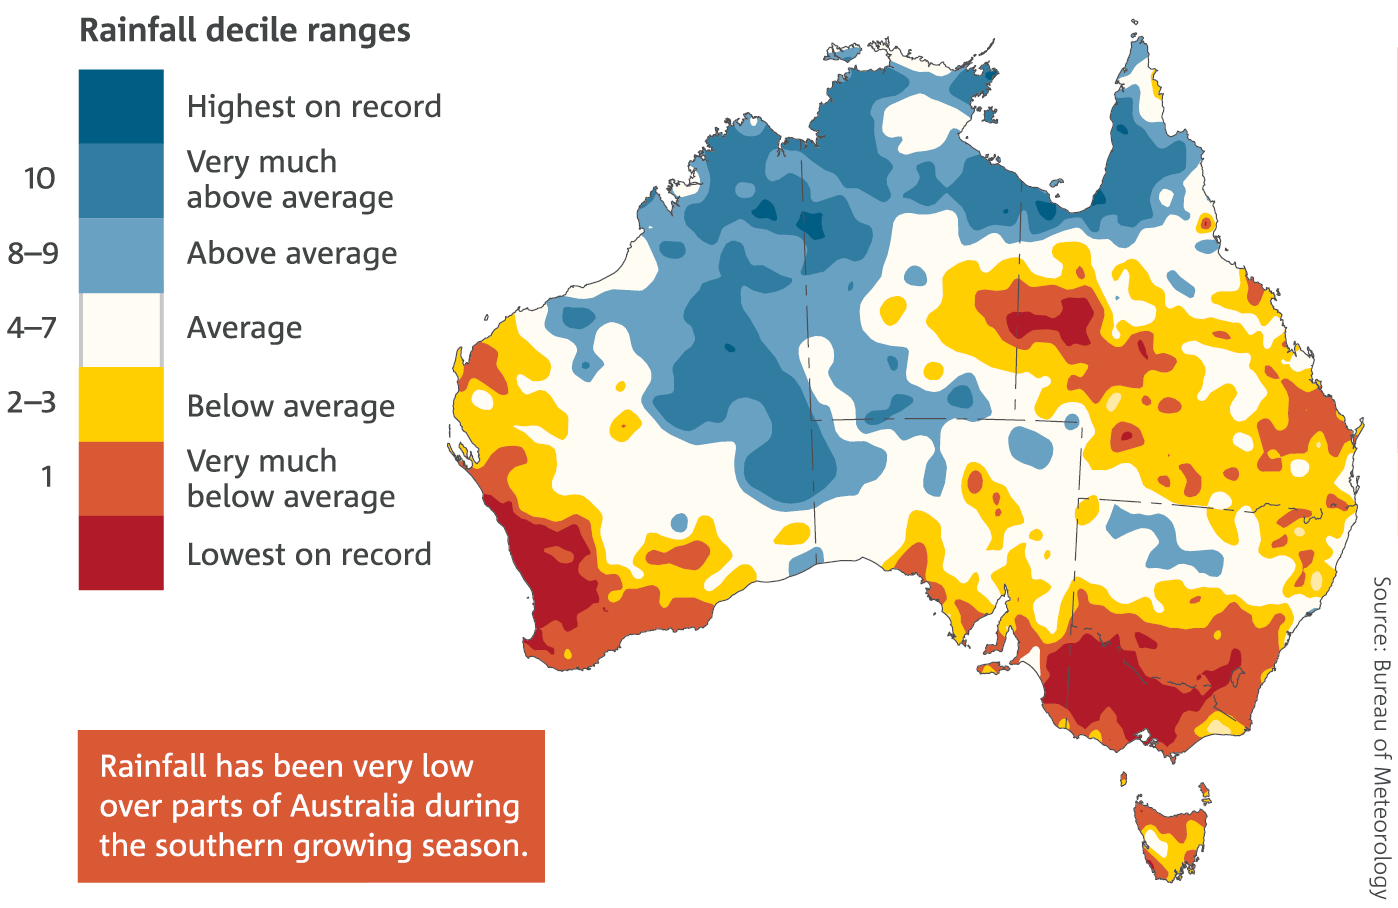
There has been significant drying across southern Australia, especially across the cool April–October growing season. For the southeast of the continent, rainfall for the period 1996 to 2015 has decreased by around 11 per cent since national rainfall records began in 1900. This period encompasses the Millennium Drought, which saw low annual rainfall totals across the region from 1997 to 2010. The drying trend is particularly strong between May and July over southwest Western Australia, with rainfall since 1970 around 19 per cent less than the long-term average. Since 1996, this decline from the long-term average has increased to around 25 per cent.
The recent drying across southern Australia is the strongest recorded large-scale change in rainfall since national records began in 1900. This decrease, at an agriculturally and hydrologically important time of the year, is associated with a trend towards higher mean sea level pressure in the region. This shift in pressure is in turn associated with a shift in large-scale weather patterns. There has been a reduction in the number of cold fronts impacting the southwest and a decrease in the incidence and intensity of weather systems known as ‘cut-off lows’ in the southeast. A known response to global warming is an increase in mean sea level pressure across southern Australian latitudes. A recent attribution study, led by CSIRO, shows that the extremely high pressures across southeast Australia in August 2014 were more likely to occur due to global warming. Year-to-year variability occurs against the background drying trend in the southeast. This means that years with lower-than-average growing season rainfall are expected to be more frequent than in the past. Southeast Australia had below-average rainfall in sixteen of the last twenty April–October periods since 1997.
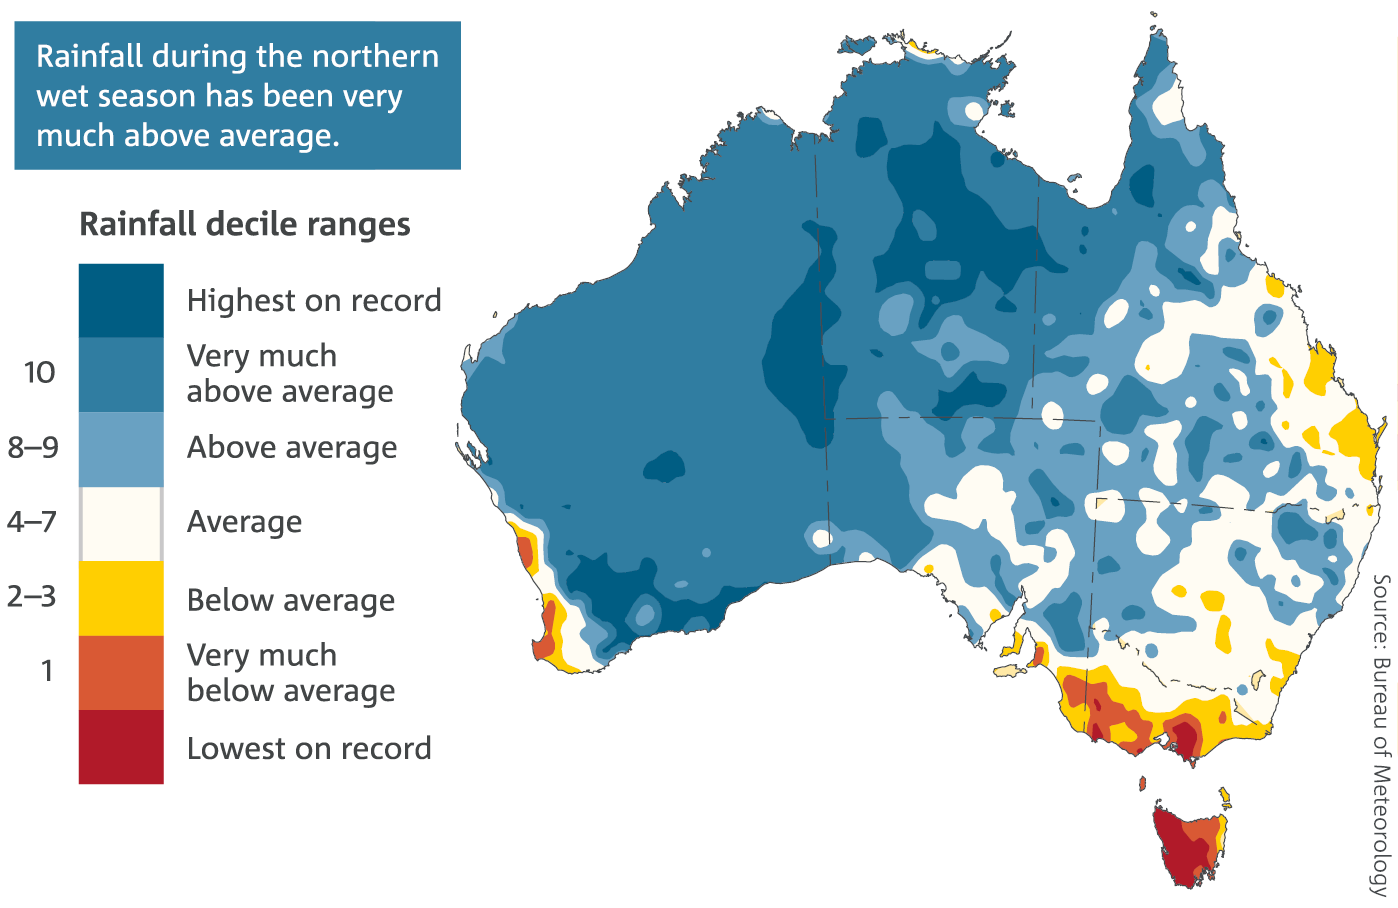
In northern Australia, most rain falls between October and April associated with the summer monsoon, with large year-to-year variability. Monsoonal lows, widespread thunderstorms and tropical cyclones often bring heavy rainfall. Since the 1970s, there has been increased rainfall across northern Australia.
Heavy rainfall
There is mixed evidence for changes in heavy rainfall over Australia. Studies show either no trend, or that a small but increasing proportion of Australia received more rain from heavy rain days during the period 1950–2012. Large variability in extreme rainfall events from decade to decade is also evident, with very wet events often associated with La Niña years.
Streamflow
The reduction in rainfall across southern Australia is amplified in streamflow. In the far southwest, streamflow has declined by more than 50 per cent since the mid-1970s. Since the mid-1990s, streamflow in the southeast is around half the long-term average. During the same period, streamflow in the Murray–Darling Basin was 41 per cent lower than average and in some basins in the west and central regions of Victoria, such as the Campaspe Basin, streamflows have declined more than 70 per cent. A recent analysis of hydrologic stations with at least 30 years of high-quality records shows a trend to lower streamflows for southwest and southeast Australia and strong evidence of a trend to higher streamflows in far northern Australia.
Tropical cyclones
The number of tropical cyclones in the Australian region varies with El Niño and La Niña events. Observations show that when this variability is accounted for there is a statistically significant downward trend in the number of tropical cyclones in the Australian region of responsibility for observing tropical cyclones (i.e. the ocean and land areas from 90°E to 160°E in the southern hemisphere). This trend is calculated using the available high-quality data from 1982 to present. In contrast to the number of tropical cyclones, the statistical significance of any observed trend in tropical cyclone intensity is overshadowed by large uncertainties due to the short satellite record and high variability.
How do we know which baseline period to use?
The World Meteorological Organization’s standard reference period, for use in monitoring long-term climate change, is the 30-year period 1961–1990. This State of the Climate report uses that baseline period for long-term averages where suitable data are available, while normally using the full period of available nationwide data for extremes and frequency distributions. Records from the monitoring of the ocean, atmosphere and land can vary in length, influencing the baselines that we use.
National records across Australia are available for rainfall from 1900, and for monthly temperature, from consistent thermometer screens, from 1910. Digitised daily temperature records become widespread from 1950 onwards, and hence a period beginning in 1951 is used as the initial baseline for daily temperature distributions.
The measurement of atmospheric constituents such as CO2 began in Mauna Loa, Hawaii in 1958, and clean air baseline measurements started in the mid-1970s at Cape Grim, Tasmania.
High-quality satellite altimeter data has been available for monitoring sea level of the oceans surrounding Australia since 1993. Sea level measurements can also be taken from tide gauges along the Australian coastline.
Archives of in situ sea surface temperature measurements extend back more than 160 years, with increasing spatial coverage in recent decades. The number of ocean temperature profile measurements in the upper 700 m have increased since the 1950s. For depths below 2000 m, ocean temperature profiles are largely measured by ship-based surveys (GO-SHIP) since the 1970s. In 2006, the Argo profiling float array achieved near-global coverage for the upper 2000 m.
Satellite measurements started in the late 1970s and provide information about sea-ice, oceans and land.
Projections used in this report are from Climate Change in Australia and are generated by global climate models using different greenhouse gas and aerosol emissions scenarios. These projections are generally compared to a 1986–2005 baseline.
Temperature
Australia’s weather and climate are changing in response to a warming global climate system. Australia has warmed by around 1 °C since 1910, with most warming since 1950. Australia’s top five warmest years on record included each of the last three years—2013, 2014 and 2015; 2013 was Australia’s warmest year on record. The warming trend occurs against a background of year-to-year climate variability, mostly associated with El Niño and La Niña in the tropical Pacific Ocean.
Sea surface temperatures in the Australian region have warmed by nearly 1 °C since 1900, with the past three years, 2013–2015, all in the region’s five warmest years on record.
The shift to a warmer climate in Australia is accompanied by more extreme heat events on daily, multi-day and seasonal timescales.
Australia-wide, increases in average temperature have been more notable across autumn, winter and spring, with the smallest trends in summer. The last three years (2013, 2014, and 2015) have seen the warmest spring seasons on record. Recent attribution studies reveal that the underlying global warming trend was important in driving the unusually warm temperatures experienced during those three spring seasons.
Across Australia, the increases in averaged monthly maximum and minimum temperatures have shifted the temperature distribution, and led to an increase in warm extremes. Very warm monthly maximum temperatures that occurred around 2 per cent of the time during the period 1951–1980 occurred over 11 per cent of the time during the period 2001–2015. Very warm monthly minimum, or night-time, temperatures that occurred 2 per cent of the time in the 1951–1980 period now occur nearly 9 per cent of the time. Examining the temperature distribution shifts in this way can assist in detecting changes in the climate system.
Determining the cause of extreme weather events
As the global climate system has warmed, changes have occurred to both the frequency and severity of extreme weather. In Australia, the most obvious change has been an increase in the occurrence of record-breaking heat. Quantifying the influence of increasing atmospheric greenhouse gases on extreme weather events is an important component of communicating and planning for future climate change.
A growing amount of research, including published work from the Bureau of Meteorology and CSIRO, estimates the relative contributions of natural variability and climate change to individual extreme events. These studies use statistical modelling, dynamical climate modelling and weather forecasting techniques.
For example, in 2014, Australia experienced daytime temperatures during October–November that were a record 2.47 °C above the 1961–1990 mean. Our research shows that the same weather systems in a lower CO2 environment, typical of 1960, would have been warm over the southeast, but not record-breaking. Similarly, a Bureau of Meteorology study of Australia’s record-breaking temperatures of September 2013 found that about 15 per cent of the record temperature anomaly can be explained by global warming.
Extreme temperature events that occur over large areas of the continent are also increasing in frequency. This is illustrated by an increase in the number of days per year when the Australian area-averaged daily mean temperature is extreme. In this instance, extreme days are defined as those above the 99th percentile of each month from the years 1910–2015. In 2013 there were 28 days over this threshold. This compares to the period prior to 1950 when more than half the years had no extreme days.
The number of days per year with maximum temperatures greater than 35 °C varies across Australia. In some parts of northern Australia there can be years with more than 150 days warmer than 35 °C. In areas of southern Australia, such as Tasmania, on average fewer than 15 days are warmer than 35 °C. The number of these hot days per year has increased over most parts of Australia. In parts of the northwest, where rainfall has increased, the number of hot days has decreased.
Fire weather
Fire weather is monitored in Australia with the Forest Fire Danger Index (FFDI). This helps estimate the fire danger on a given day based on observations of temperature, humidity, wind speed and rainfall. The annual 90th percentile of daily FFDI points has increased since 1974 across Australia, especially in southern and eastern Australia, and the fire season has lengthened. Increasing temperatures and drying contributed to the observed upward trend in FFDI. Considerable year-to-year variability is also seen, with La Niña years (e.g. 2010–11 and 1999–2000) generally associated with a lower frequency of days with high values of FFDI.
Rainfall
Australian rainfall varies greatly from one year to the next and from one decade to the next, and is strongly influenced by phenomena such as El Niño and La Niña. Despite this large natural variability, underlying longer-term trends are evident in some regions.
There has been significant drying across southern Australia, especially across the cool April–October growing season. For the southeast of the continent, rainfall for the period 1996 to 2015 has decreased by around 11 per cent since national rainfall records began in 1900. This period encompasses the Millennium Drought, which saw low annual rainfall totals across the region from 1997 to 2010. The drying trend is particularly strong between May and July over southwest Western Australia, with rainfall since 1970 around 19 per cent less than the long-term average. Since 1996, this decline from the long-term average has increased to around 25 per cent.
The recent drying across southern Australia is the strongest recorded large-scale change in rainfall since national records began in 1900. This decrease, at an agriculturally and hydrologically important time of the year, is associated with a trend towards higher mean sea level pressure in the region. This shift in pressure is in turn associated with a shift in large-scale weather patterns. There has been a reduction in the number of cold fronts impacting the southwest and a decrease in the incidence and intensity of weather systems known as ‘cut-off lows’ in the southeast. A known response to global warming is an increase in mean sea level pressure across southern Australian latitudes. A recent attribution study, led by CSIRO, shows that the extremely high pressures across southeast Australia in August 2014 were more likely to occur due to global warming. Year-to-year variability occurs against the background drying trend in the southeast. This means that years with lower-than-average growing season rainfall are expected to be more frequent than in the past. Southeast Australia had below-average rainfall in sixteen of the last twenty April–October periods since 1997.
In northern Australia, most rain falls between October and April associated with the summer monsoon, with large year-to-year variability. Monsoonal lows, widespread thunderstorms and tropical cyclones often bring heavy rainfall. Since the 1970s, there has been increased rainfall across northern Australia.
Heavy rainfall
There is mixed evidence for changes in heavy rainfall over Australia. Studies show either no trend, or that a small but increasing proportion of Australia received more rain from heavy rain days during the period 1950–2012. Large variability in extreme rainfall events from decade to decade is also evident, with very wet events often associated with La Niña years.
Streamflow
The reduction in rainfall across southern Australia is amplified in streamflow. In the far southwest, streamflow has declined by more than 50 per cent since the mid-1970s. Since the mid-1990s, streamflow in the southeast is around half the long-term average. During the same period, streamflow in the Murray–Darling Basin was 41 per cent lower than average and in some basins in the west and central regions of Victoria, such as the Campaspe Basin, streamflows have declined more than 70 per cent. A recent analysis of hydrologic stations with at least 30 years of high-quality records shows a trend to lower streamflows for southwest and southeast Australia and strong evidence of a trend to higher streamflows in far northern Australia.
Tropical cyclones
The number of tropical cyclones in the Australian region varies with El Niño and La Niña events. Observations show that when this variability is accounted for there is a statistically significant downward trend in the number of tropical cyclones in the Australian region of responsibility for observing tropical cyclones (i.e. the ocean and land areas from 90°E to 160°E in the southern hemisphere). This trend is calculated using the available high-quality data from 1982 to present. In contrast to the number of tropical cyclones, the statistical significance of any observed trend in tropical cyclone intensity is overshadowed by large uncertainties due to the short satellite record and high variability.
How do we know which baseline period to use?
The World Meteorological Organization’s standard reference period, for use in monitoring long-term climate change, is the 30-year period 1961–1990. This State of the Climate report uses that baseline period for long-term averages where suitable data are available, while normally using the full period of available nationwide data for extremes and frequency distributions. Records from the monitoring of the ocean, atmosphere and land can vary in length, influencing the baselines that we use.
National records across Australia are available for rainfall from 1900, and for monthly temperature, from consistent thermometer screens, from 1910. Digitised daily temperature records become widespread from 1950 onwards, and hence a period beginning in 1951 is used as the initial baseline for daily temperature distributions.
The measurement of atmospheric constituents such as CO2 began in Mauna Loa, Hawaii in 1958, and clean air baseline measurements started in the mid-1970s at Cape Grim, Tasmania.
High-quality satellite altimeter data has been available for monitoring sea level of the oceans surrounding Australia since 1993. Sea level measurements can also be taken from tide gauges along the Australian coastline.
Archives of in situ sea surface temperature measurements extend back more than 160 years, with increasing spatial coverage in recent decades. The number of ocean temperature profile measurements in the upper 700 m have increased since the 1950s. For depths below 2000 m, ocean temperature profiles are largely measured by ship-based surveys (GO-SHIP) since the 1970s. In 2006, the Argo profiling float array achieved near-global coverage for the upper 2000 m.
Satellite measurements started in the late 1970s and provide information about sea-ice, oceans and land.
Projections used in this report are from Climate Change in Australia and are generated by global climate models using different greenhouse gas and aerosol emissions scenarios. These projections are generally compared to a 1986–2005 baseline.