Monitoring greenhouse gases at Cape Grim
Cape Grim, on Tasmania’s northwest coast, is one of only three World Meteorological Organization (WMO) global super-stations for the measurement of greenhouse gases.
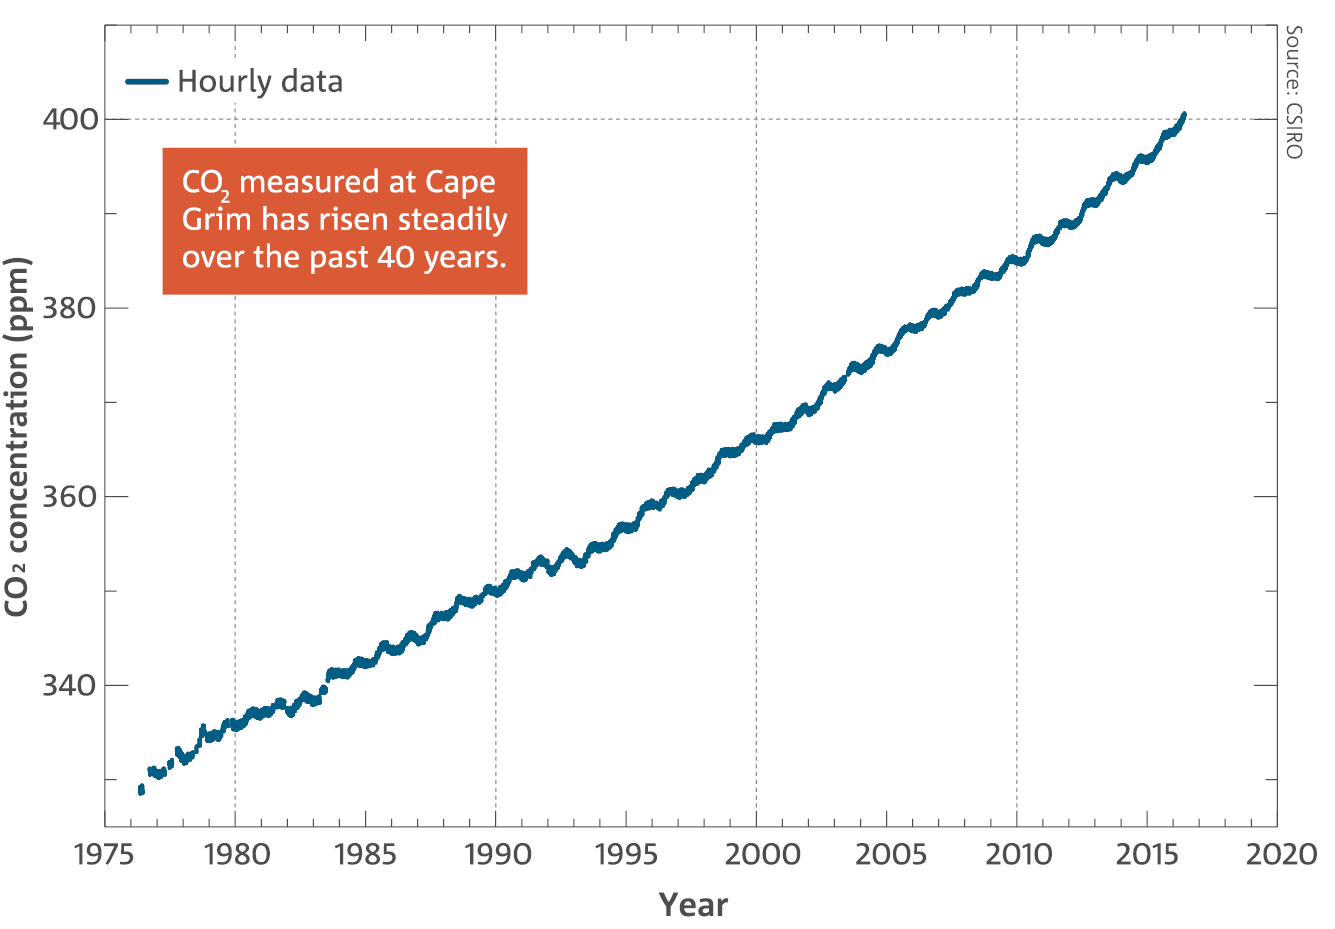
This year, 2016, marks the 40th anniversary of the first greenhouse gas measurements at Cape Grim. CO2 (carbon dioxide) and CFC (chlorofluorocarbon, a potent synthetic greenhouse gas responsible for the ozone hole) measurements began in 1976 and later extended to cover all major greenhouse gases. Cape Grim’s location is unique in that its exposure to the weather systems coming across the Southern Ocean mean that about 40 per cent of the time atmospheric measurements are not influenced by local sources of pollution.
Cape Grim greenhouse gas data are freely available, and are widely used to quantify global, regional and Australian emissions of greenhouse gases. They have been used in hundreds of research papers on climate change and ozone depletion, which have been cited in all five Intergovernmental Panel on Climate Change (IPCC) international assessments of climate change and in all seven United Nations Environment Programme (UNEP)/WMO international assessments of ozone depletion. Cape Grim greenhouse gas data also provide independent verification of Australia’s National Greenhouse Gas Inventory, which reports Australia’s annual emissions to the United Nations Framework Convention on Climate Change. Cape Grim air is analysed in situ, but also in CSIRO’s GASLAB in Melbourne and in a number of laboratories around the world.
CSIRO commenced collection of the Cape Grim Air Archive in 1978; this long-running collection forms a critical component of the world’s background atmospheric air samples, underpinning extensive research on global and Australian emissions of greenhouse and ozone-depleting gases.
Greenhouse gases
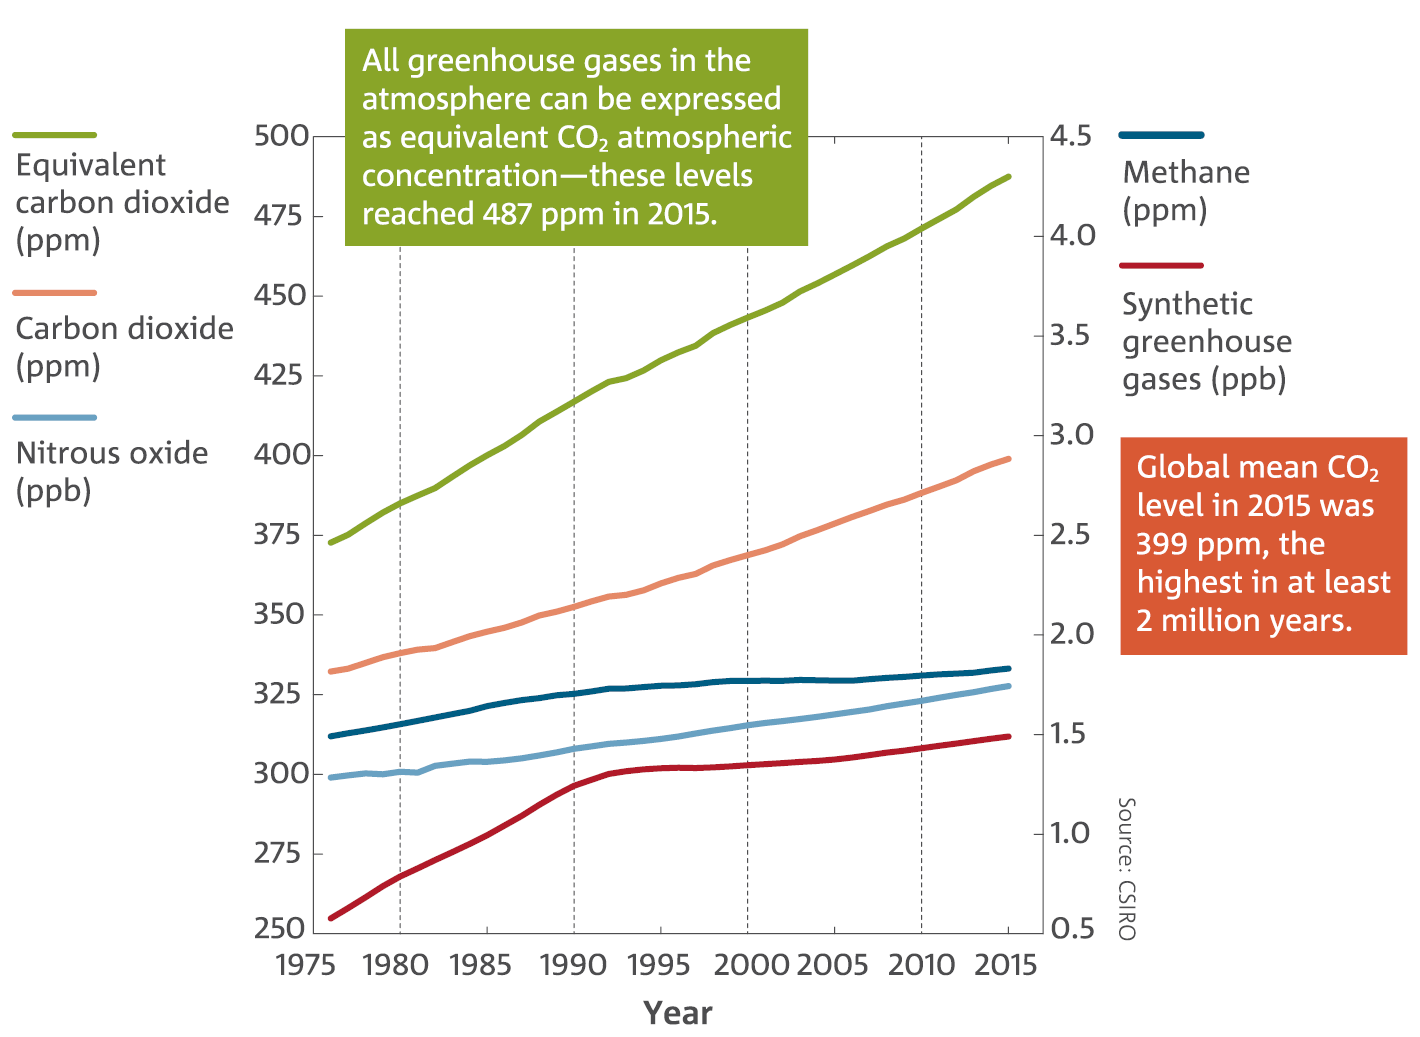
Global atmospheric concentrations of the major long-lived greenhouse gases, carbon dioxide (CO2), methane (CH4), nitrous oxide (N2O) and a group of synthetic greenhouse gases, continue to rise. The amounts of CO2, CH4 and N2O in the atmosphere show significant seasonal and year-to-year variabilities, but all show ongoing upward trends.
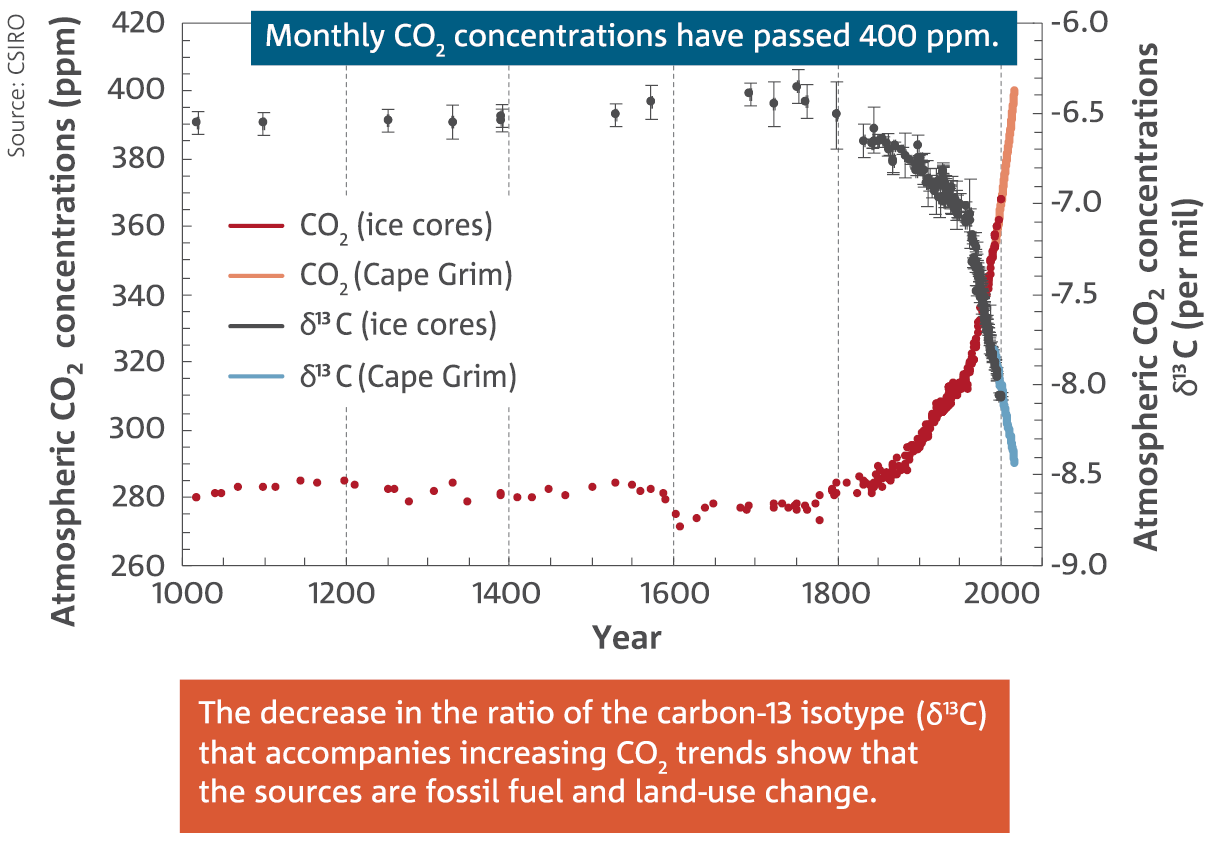
The global mean CO2 level in 2015 was 399 ppm—a 44 per cent increase from the concentration of 278 ppm around the year 1750, and likely the highest level in at least the past two million years. The global annual average CO2 level is almost certain to exceed 400 ppm for 2016. Measurements at Cape Grim in Tasmania exceeded 400 ppm in May 2016. The impact of all greenhouse gases in the atmosphere combined can be expressed as an ‘equivalent CO2’ atmospheric concentration, which reached 487 ppm in 2015.
The global annual CO2 increase in 2015 was 3.0 ppm, the largest ever observed. The previous record annual increase was 2.6 ppm, set in 2013. During 2015 the rate of increase in fossil fuel emissions slowed. However, the strong El Niño, which led to increased fires and associated greenhouse gas emissions, as well as a weakening of natural CO2 sinks through drought and reduced rainfall over large regions led to increased emissions from natural sources in 2015.
Analysis of the different types (or isotopes) of carbon in atmospheric CO2 shows that the additional CO2 since 1750 in the atmosphere results from human activities, predominantly the burning of fossil fuels.
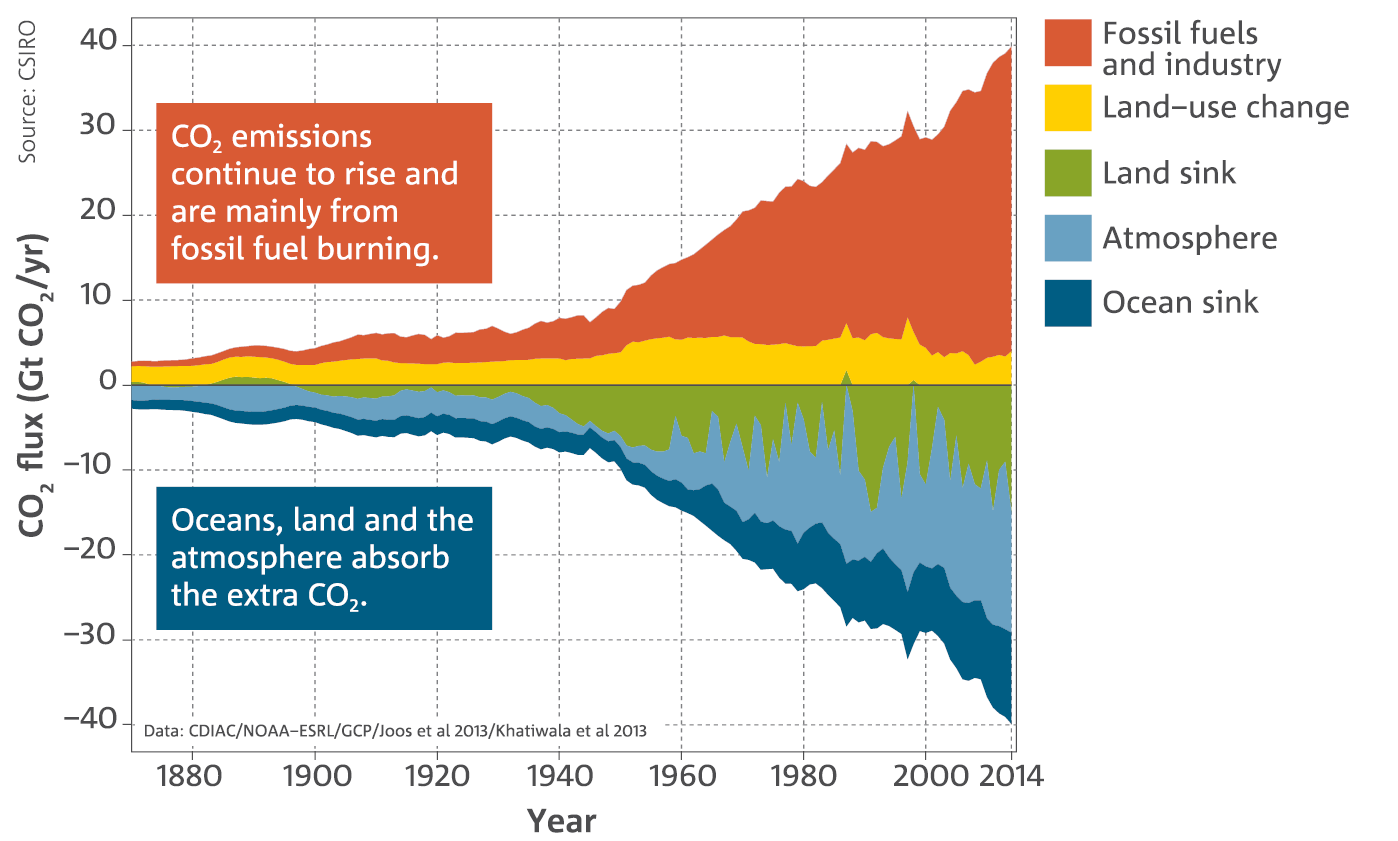
Over the last 250 years, about 30 per cent of the anthropogenic (caused by human activity) CO2 emissions have been taken up by the ocean and about 30 per cent by the land. The remaining 40 per cent of emissions have led to the observed increase in the concentration of CO2 in the atmosphere.
Monitoring greenhouse gases at Cape Grim
Cape Grim, on Tasmania’s northwest coast, is one of only three World Meteorological Organization (WMO) global super-stations for the measurement of greenhouse gases.
This year, 2016, marks the 40th anniversary of the first greenhouse gas measurements at Cape Grim. CO2 (carbon dioxide) and CFC (chlorofluorocarbon, a potent synthetic greenhouse gas responsible for the ozone hole) measurements began in 1976 and later extended to cover all major greenhouse gases. Cape Grim’s location is unique in that its exposure to the weather systems coming across the Southern Ocean mean that about 40 per cent of the time atmospheric measurements are not influenced by local sources of pollution.
Cape Grim greenhouse gas data are freely available, and are widely used to quantify global, regional and Australian emissions of greenhouse gases. They have been used in hundreds of research papers on climate change and ozone depletion, which have been cited in all five Intergovernmental Panel on Climate Change (IPCC) international assessments of climate change and in all seven United Nations Environment Programme (UNEP)/WMO international assessments of ozone depletion. Cape Grim greenhouse gas data also provide independent verification of Australia’s National Greenhouse Gas Inventory, which reports Australia’s annual emissions to the United Nations Framework Convention on Climate Change. Cape Grim air is analysed in situ, but also in CSIRO’s GASLAB in Melbourne and in a number of laboratories around the world.
CSIRO commenced collection of the Cape Grim Air Archive in 1978; this long-running collection forms a critical component of the world’s background atmospheric air samples, underpinning extensive research on global and Australian emissions of greenhouse and ozone-depleting gases.
Greenhouse gases
Global atmospheric concentrations of the major long-lived greenhouse gases, carbon dioxide (CO2), methane (CH4), nitrous oxide (N2O) and a group of synthetic greenhouse gases, continue to rise. The amounts of CO2, CH4 and N2O in the atmosphere show significant seasonal and year-to-year variabilities, but all show ongoing upward trends.
The global mean CO2 level in 2015 was 399 ppm—a 44 per cent increase from the concentration of 278 ppm around the year 1750, and likely the highest level in at least the past two million years. The global annual average CO2 level is almost certain to exceed 400 ppm for 2016. Measurements at Cape Grim in Tasmania exceeded 400 ppm in May 2016. The impact of all greenhouse gases in the atmosphere combined can be expressed as an ‘equivalent CO2’ atmospheric concentration, which reached 487 ppm in 2015.
The global annual CO2 increase in 2015 was 3.0 ppm, the largest ever observed. The previous record annual increase was 2.6 ppm, set in 2013. During 2015 the rate of increase in fossil fuel emissions slowed. However, the strong El Niño, which led to increased fires and associated greenhouse gas emissions, as well as a weakening of natural CO2 sinks through drought and reduced rainfall over large regions led to increased emissions from natural sources in 2015.
Analysis of the different types (or isotopes) of carbon in atmospheric CO2 shows that the additional CO2 since 1750 in the atmosphere results from human activities, predominantly the burning of fossil fuels.
Over the last 250 years, about 30 per cent of the anthropogenic (caused by human activity) CO2 emissions have been taken up by the ocean and about 30 per cent by the land. The remaining 40 per cent of emissions have led to the observed increase in the concentration of CO2 in the atmosphere.