Greenhouse gases
- Global average concentrations of all the major long-lived greenhouse gases continue to rise in the atmosphere, with the global annual mean carbon dioxide concentration reaching 410 ppm and CO2 equivalent reaching 508 ppm in 2019.
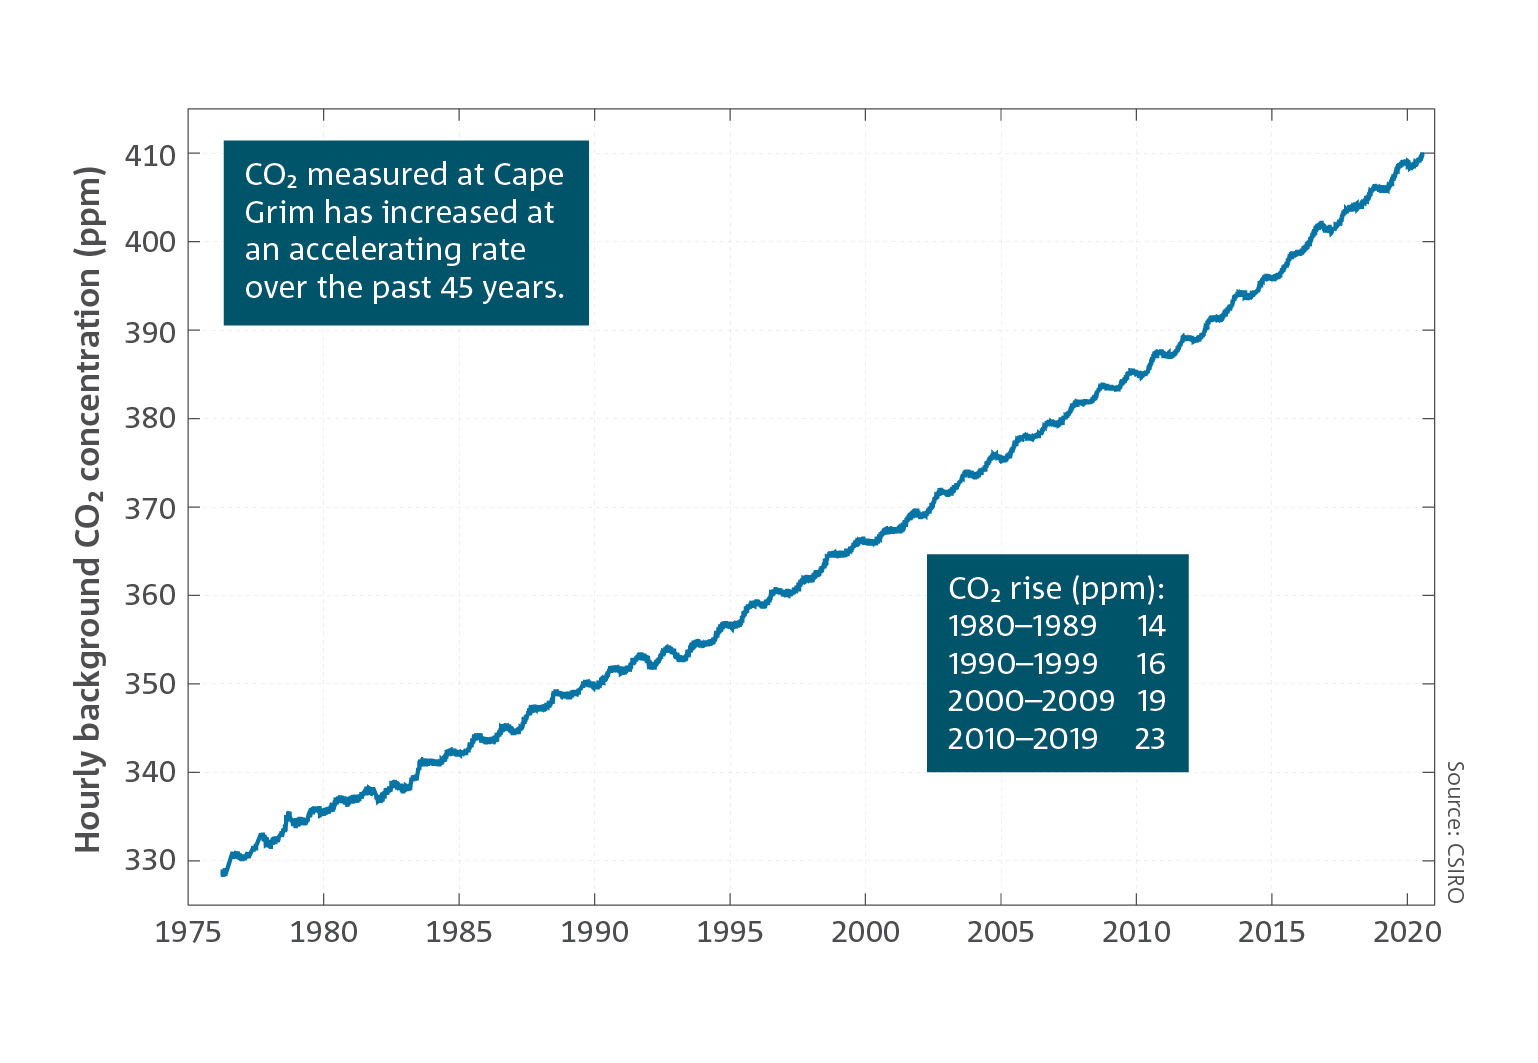
- The rate of CO2 accumulation in the atmosphere has increased with every passing decade since atmospheric measurements began.
- Despite the slow-down in global fossil fuel emissions of CO2 from early 2020 associated with the COVID-19 pandemic, there will be negligible impacts in terms of climate change. Atmospheric CO2 continues to rise, and fossil fuel emissions will remain the principal driver of this growth throughout 2020 and likely beyond.
 The global annual mean CO2 level in 2019 was 410 parts per million (ppm), marking a 47 per cent increase from the pre-industrial concentration of 278 ppm in 1750. The rise in atmospheric CO2 has been caused by emissions from fossil fuel use and land-use changes, leading to increased heat energy in the Earth’s climate system.
Cumulative emissions of CO2 will largely determine the speed and magnitude of global mean surface warming during this century and beyond. By 2019 human activities had already emitted 70 per cent of the cumulative emissions allowed to keep global temperatures below 2 °C warming (since 1850) with at least a 66 per cent chance. Because increased levels of CO2 and other long-lived greenhouse gases, i.e. methane (CH4), nitrous oxide (N2O) and some synthetic gases such as the chlorofluorocarbons (CFCs), persist in the atmosphere for decades to centuries, further warming and sea level rise is inevitable.
The Cape Grim Baseline Air Pollution Station, located at the northwest tip of Tasmania, is a key site in the World Meteorological Organization’s Global Atmosphere Watch program. Atmospheric concentrations of CO2 measured at Cape Grim, like other stations around the world, show a persistent and accelerating upward trend. The annual average at Cape Grim reached 400 ppm in 2016 and climbed to 407 ppm in 2019, slightly lower than the global average.
However atmospheric CO2 is still increasing and reduced emissions due to COVID-19 will likely reduce CO2 accumulation in the atmosphere by only about 0.2 ppm throughout 2020. This is only about 10 per cent of the recent CO2 growth rates of 2 to 3 ppm per year and, at most, 20 per cent of the year to year variability (~1 ppm) due to fluctuations in the natural carbon cycle. The effect on atmospheric greenhouse gas levels from COVID-19 related emissions reductions in 2020 will therefore be barely distinguishable from natural variability and negligible in terms of the mitigation needed to stabilise the climate.
Globally averaged atmospheric concentrations of all major long-lived greenhouse gases and the radiative forcing of a group of synthetic (i.e. industry-made) greenhouse gases continue to rise.
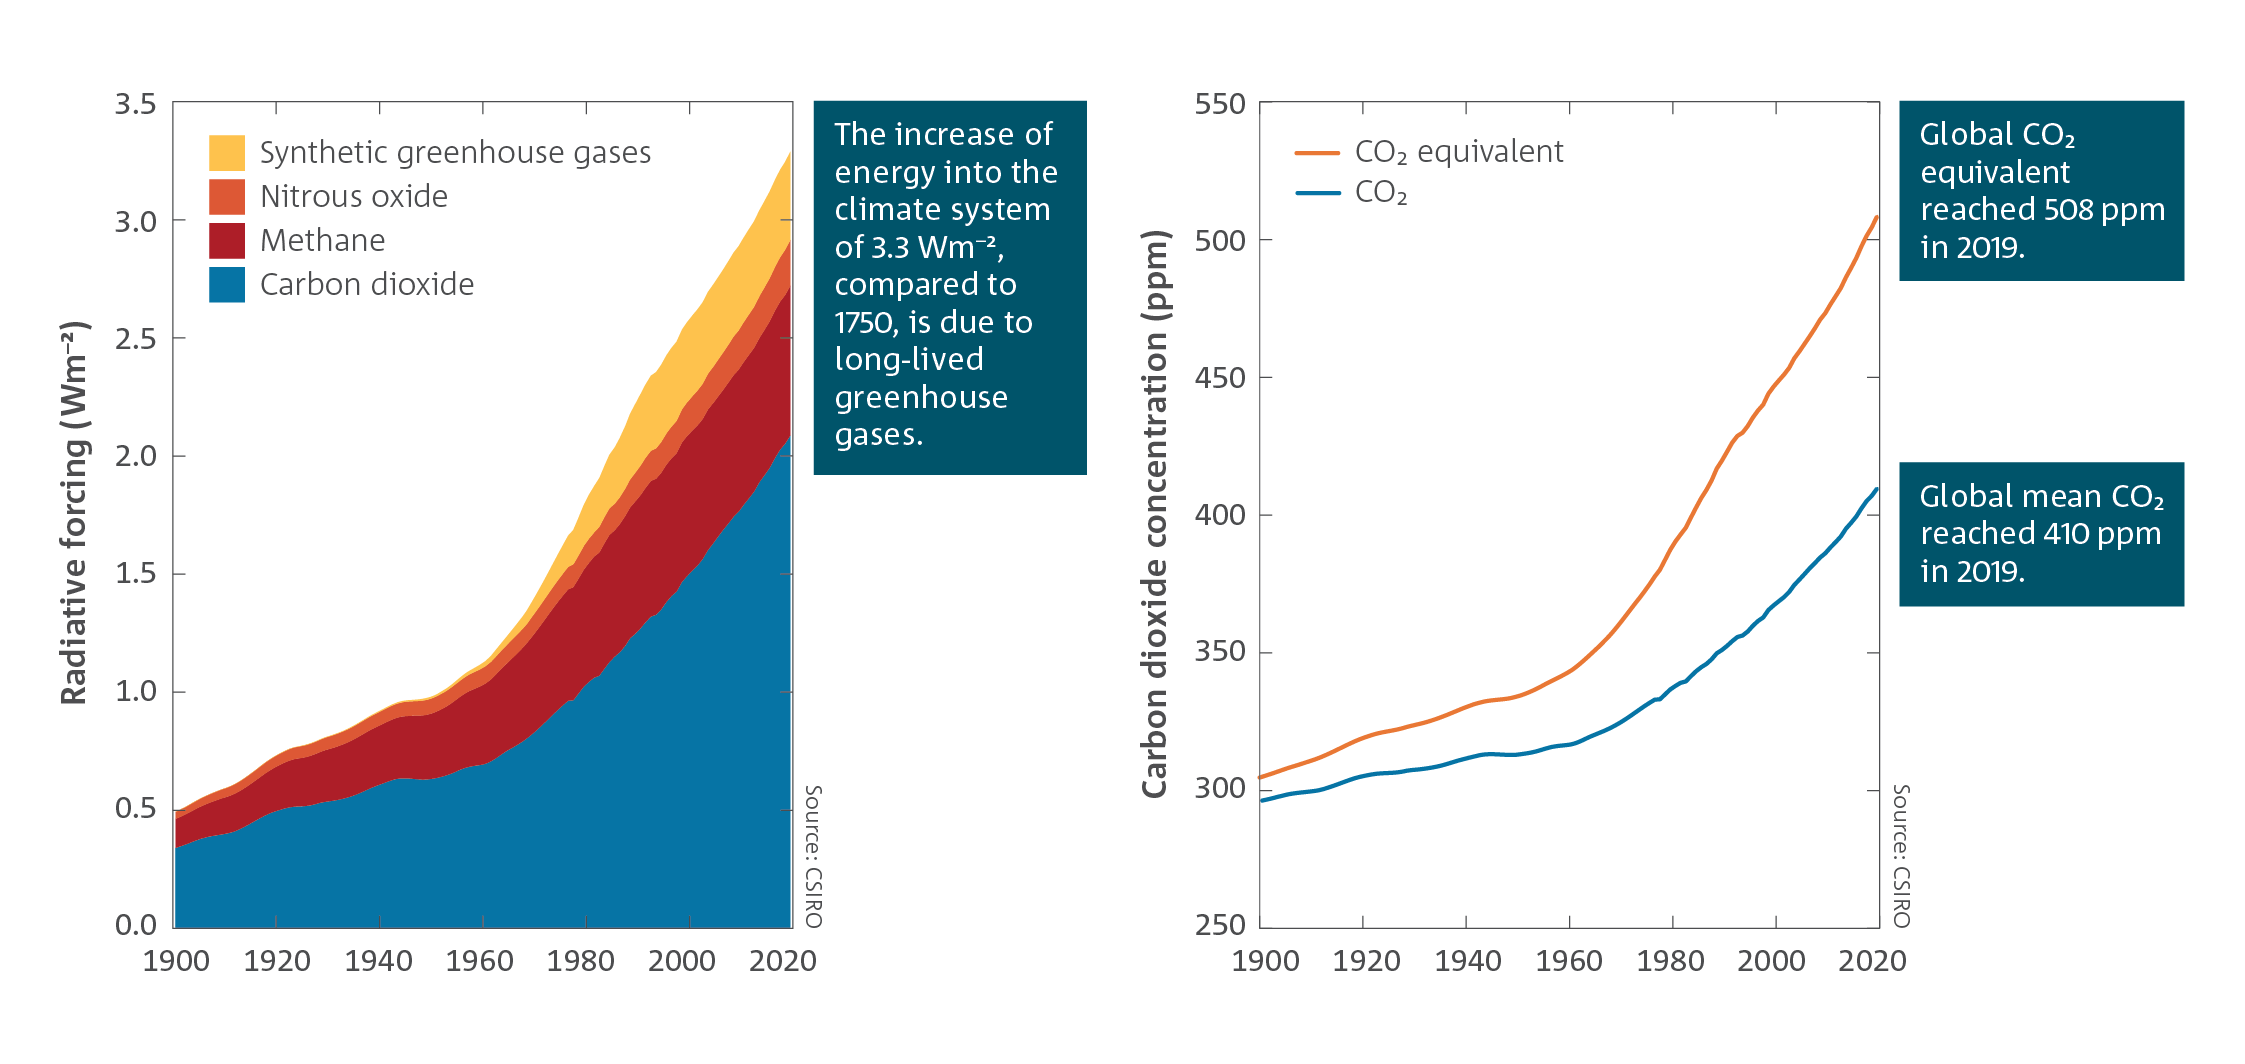
The climate effect of the changes in all the long-lived greenhouse gases in the atmosphere combined can be expressed as an enhancement of the net radiation, or radiative forcing. CO2 is the largest contributor to this, but other gases also make substantial and increasing contributions.
The impact of all greenhouse gases can be converted to an equivalent CO2 (CO2-e) atmospheric concentration. The annual average CO2-e measured at Cape Grim reached 503 ppm in 2019, which is almost twice the pre-industrial level of 278 ppm in 1750. Measurements of the carbon isotopic ratios in CO2 (that is, carbon-13 and carbon-14, relative to carbon-12) confirm that the increased CO2 originates primarily from fossil fuel and land clearing emissions.
Measurements of air extracted from Antarctic ice cores extend the atmospheric composition record back before direct observations. These measurements show that CO2 concentrations were relatively stable and averaged around 280 ppm for most of the last 2000 years until recently increasing rapidly from about 1850 to present day concentrations.
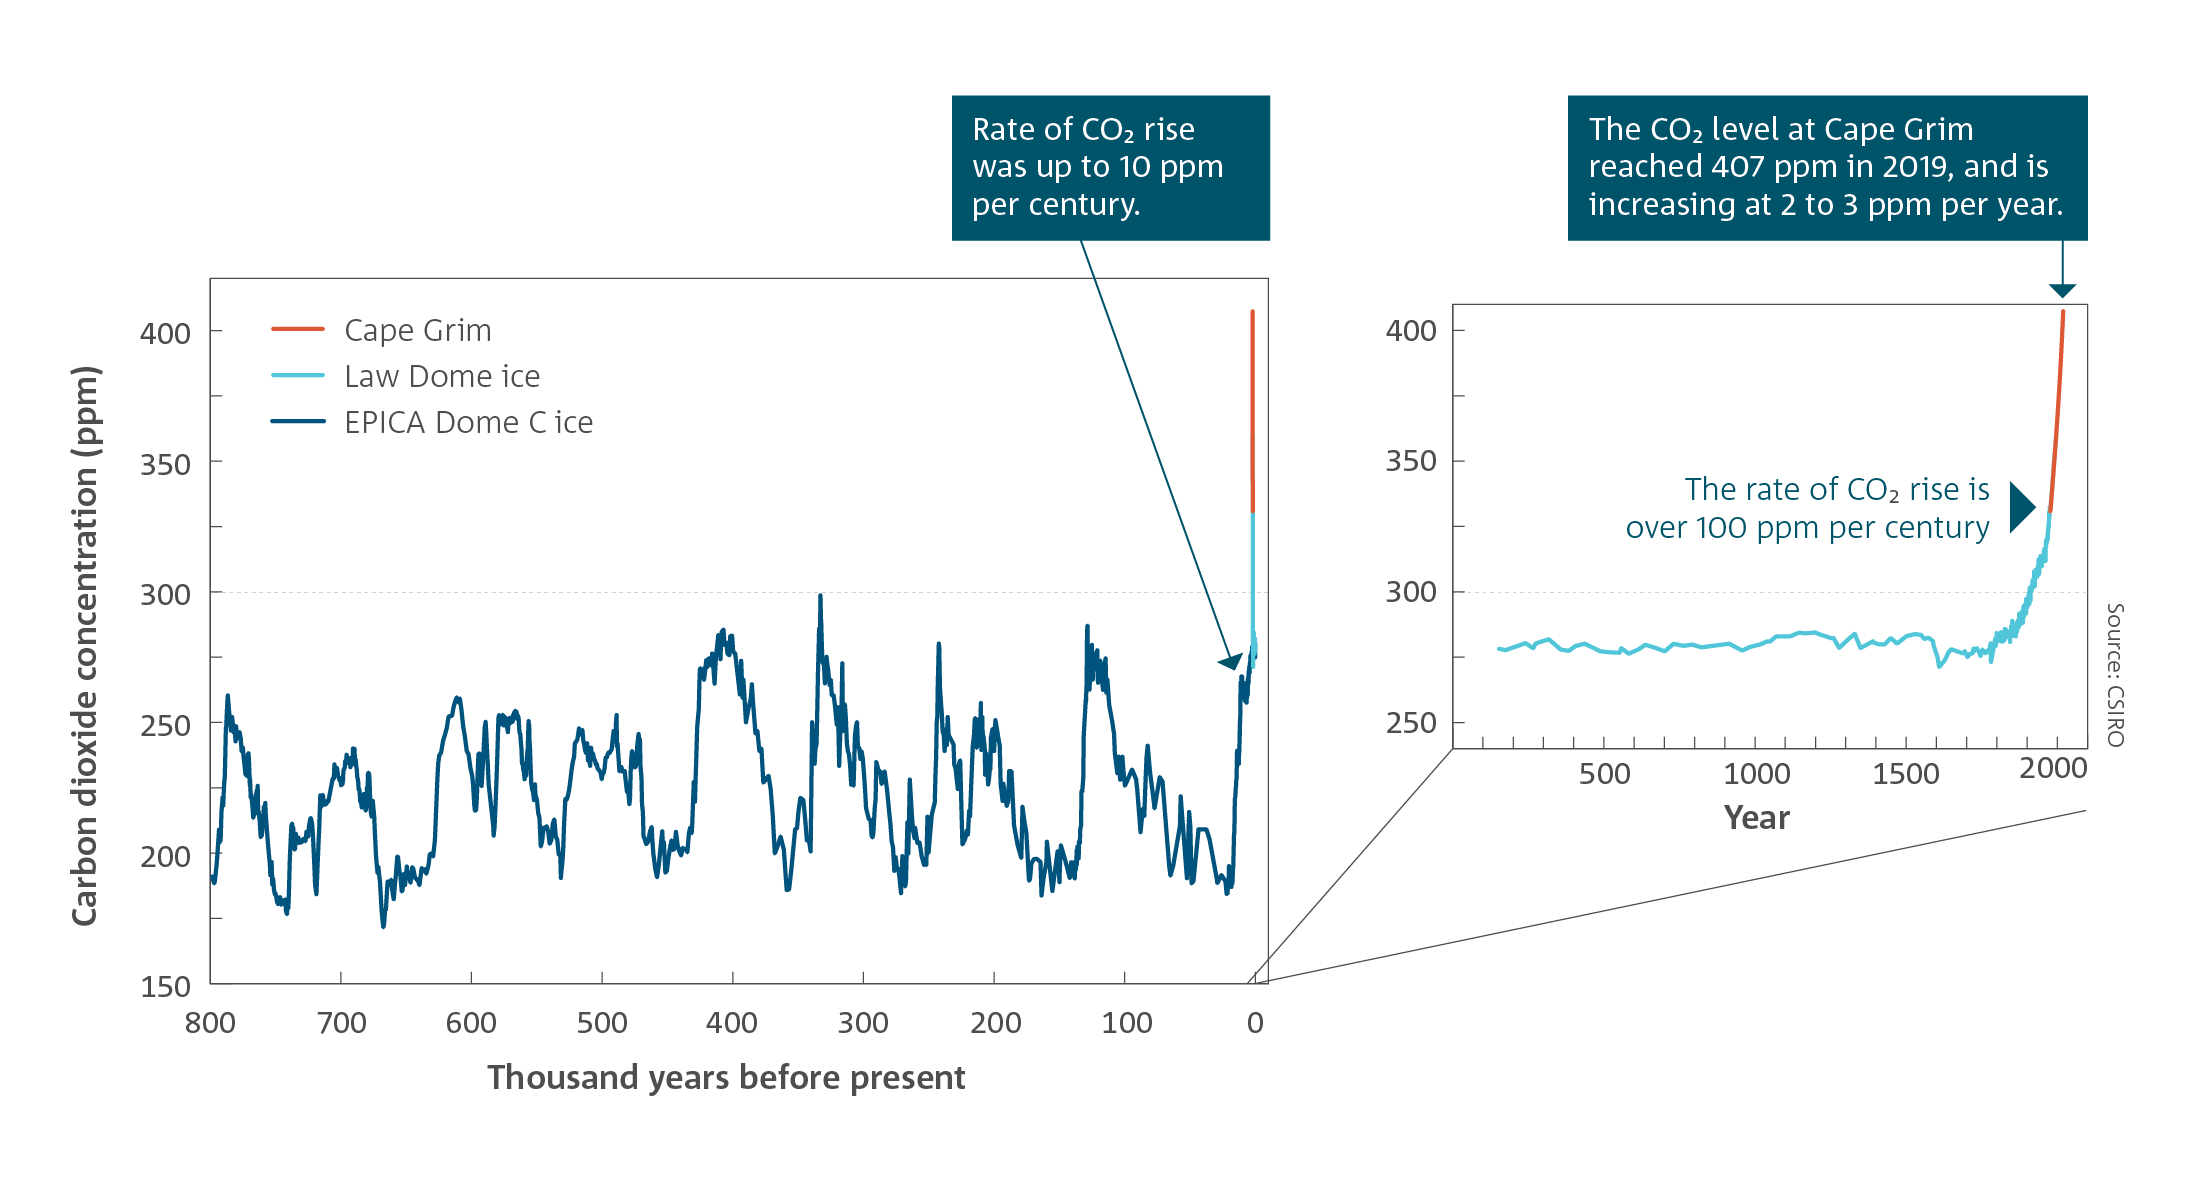
Over the previous 800,000 years, CO2 concentrations varied between about 170 ppm during colder glacial periods to nearly 300 ppm during warmer periods like today. Air extracted from Antarctic ice has recently enabled the record to be extended back to two million years ago, at discrete intervals, showing that CO2 concentrations during the past century are higher than at any time in the ice core record. Even older atmospheric CO2 concentrations can be inferred from ocean sediments and show that the last time that atmospheric CO2 concentrations were the same or higher than today was the Pliocene epoch, over 2.6 million years ago, when mean global temperatures were 2–3 °C warmer than today.
Global carbon budget
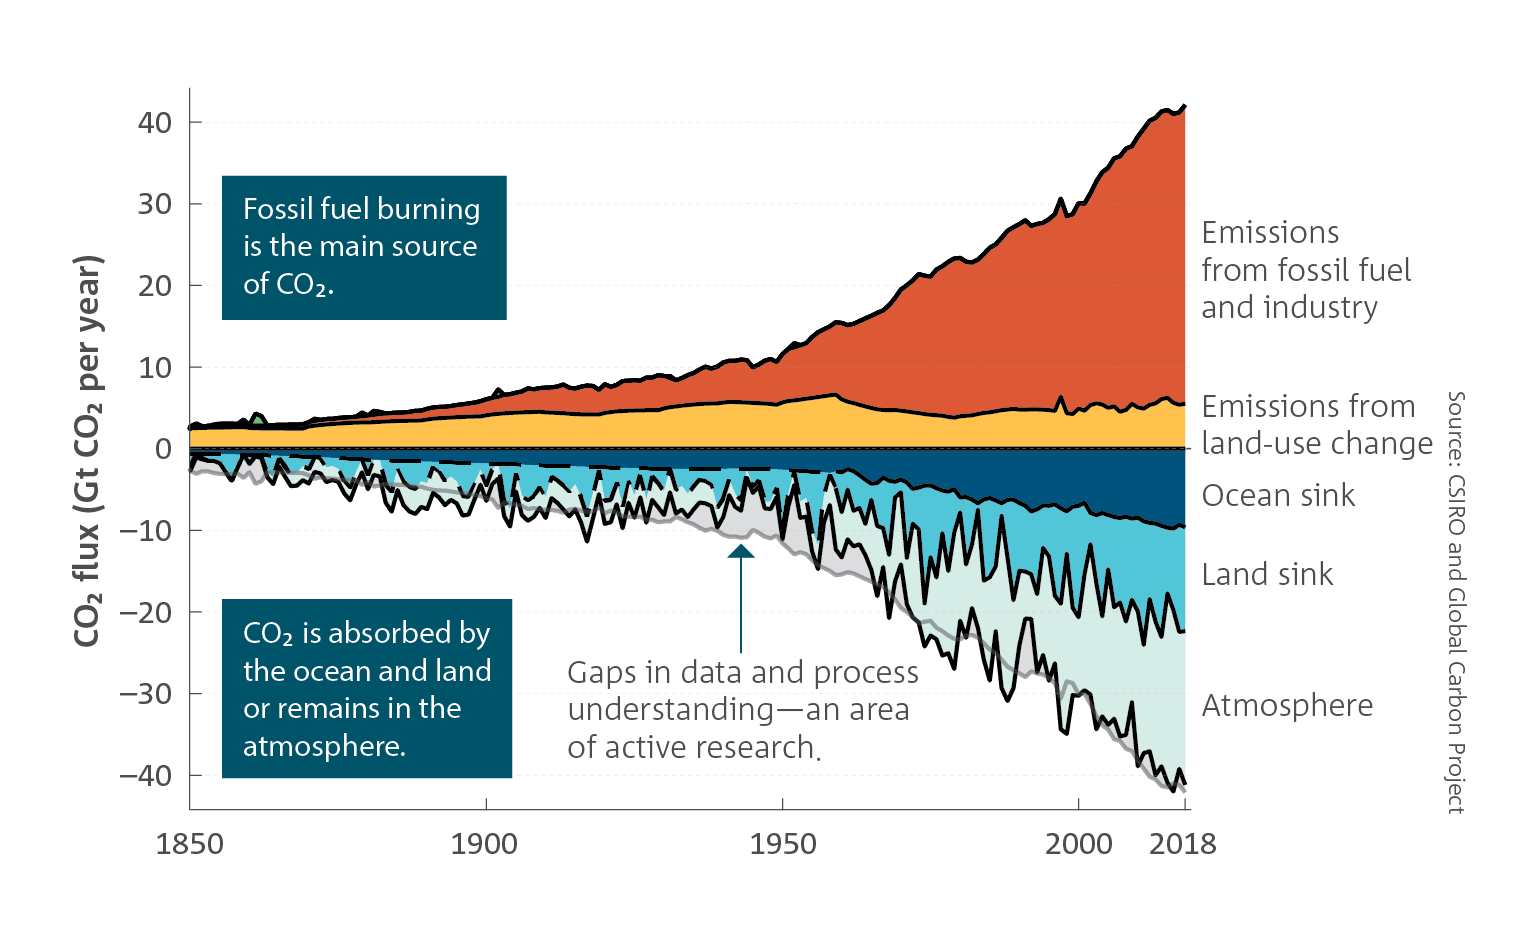 Emissions of CO2 from fossil fuel use and changes in land use have continued to increase. In the decade from 2009 to 2018, average global emissions were 41 ± 2.9 gigatonnes (Gt) of CO2 per year (one gigatonne is equal to one billion tonnes). Around 85 per cent of global CO2 emissions were from fossil fuels and 15 per cent from land-use change.
Emissions reached an all-time high of 42.9 ± 2.8 Gt CO2 in 2019. Emissions resulting from land-use change were higher in 2019 than the decadal average due to increased fire activity, particularly in Brazil.
The uptake of carbon into ocean and land sinks has grown in response to the accumulation of CO2 in the atmosphere. In the decade from 2009 to 2018, the ocean and land sinks removed on average 9 ± 2 and 12 ± 2 Gt of CO2 per year, respectively. Combined, these sinks are removing more than half of all CO2 emissions from human activities and thus are slowing the rate of increase in atmospheric CO2. Despite this important uptake by the land and ocean sinks, atmospheric CO2 has continued to increase, growing by 18 Gt CO2 per year over the decade from 2009 to 2018.
Greenhouse gases
- Global average concentrations of all the major long-lived greenhouse gases continue to rise in the atmosphere, with the global annual mean carbon dioxide concentration reaching 410 ppm and CO2 equivalent reaching 508 ppm in 2019.
- The rate of CO2 accumulation in the atmosphere has increased with every passing decade since atmospheric measurements began.
- Despite the slow-down in global fossil fuel emissions of CO2 from early 2020 associated with the COVID-19 pandemic, there will be negligible impacts in terms of climate change. Atmospheric CO2 continues to rise, and fossil fuel emissions will remain the principal driver of this growth throughout 2020 and likely beyond.
The global annual mean CO2 level in 2019 was 410 parts per million (ppm), marking a 47 per cent increase from the pre-industrial concentration of 278 ppm in 1750. The rise in atmospheric CO2 has been caused by emissions from fossil fuel use and land-use changes, leading to increased heat energy in the Earth’s climate system.
Cumulative emissions of CO2 will largely determine the speed and magnitude of global mean surface warming during this century and beyond. By 2019 human activities had already emitted 70 per cent of the cumulative emissions allowed to keep global temperatures below 2 °C warming (since 1850) with at least a 66 per cent chance. Because increased levels of CO2 and other long-lived greenhouse gases, i.e. methane (CH4), nitrous oxide (N2O) and some synthetic gases such as the chlorofluorocarbons (CFCs), persist in the atmosphere for decades to centuries, further warming and sea level rise is inevitable.
The Cape Grim Baseline Air Pollution Station, located at the northwest tip of Tasmania, is a key site in the World Meteorological Organization’s Global Atmosphere Watch program. Atmospheric concentrations of CO2 measured at Cape Grim, like other stations around the world, show a persistent and accelerating upward trend. The annual average at Cape Grim reached 400 ppm in 2016 and climbed to 407 ppm in 2019, slightly lower than the global average.
However atmospheric CO2 is still increasing and reduced emissions due to COVID-19 will likely reduce CO2 accumulation in the atmosphere by only about 0.2 ppm throughout 2020. This is only about 10 per cent of the recent CO2 growth rates of 2 to 3 ppm per year and, at most, 20 per cent of the year to year variability (~1 ppm) due to fluctuations in the natural carbon cycle. The effect on atmospheric greenhouse gas levels from COVID-19 related emissions reductions in 2020 will therefore be barely distinguishable from natural variability and negligible in terms of the mitigation needed to stabilise the climate.
Globally averaged atmospheric concentrations of all major long-lived greenhouse gases and the radiative forcing of a group of synthetic (i.e. industry-made) greenhouse gases continue to rise.
The climate effect of the changes in all the long-lived greenhouse gases in the atmosphere combined can be expressed as an enhancement of the net radiation, or radiative forcing. CO2 is the largest contributor to this, but other gases also make substantial and increasing contributions.
The impact of all greenhouse gases can be converted to an equivalent CO2 (CO2-e) atmospheric concentration. The annual average CO2-e measured at Cape Grim reached 503 ppm in 2019, which is almost twice the pre-industrial level of 278 ppm in 1750. Measurements of the carbon isotopic ratios in CO2 (that is, carbon-13 and carbon-14, relative to carbon-12) confirm that the increased CO2 originates primarily from fossil fuel and land clearing emissions.
Measurements of air extracted from Antarctic ice cores extend the atmospheric composition record back before direct observations. These measurements show that CO2 concentrations were relatively stable and averaged around 280 ppm for most of the last 2000 years until recently increasing rapidly from about 1850 to present day concentrations.
Over the previous 800,000 years, CO2 concentrations varied between about 170 ppm during colder glacial periods to nearly 300 ppm during warmer periods like today. Air extracted from Antarctic ice has recently enabled the record to be extended back to two million years ago, at discrete intervals, showing that CO2 concentrations during the past century are higher than at any time in the ice core record. Even older atmospheric CO2 concentrations can be inferred from ocean sediments and show that the last time that atmospheric CO2 concentrations were the same or higher than today was the Pliocene epoch, over 2.6 million years ago, when mean global temperatures were 2–3 °C warmer than today.
Global carbon budget
Emissions of CO2 from fossil fuel use and changes in land use have continued to increase. In the decade from 2009 to 2018, average global emissions were 41 ± 2.9 gigatonnes (Gt) of CO2 per year (one gigatonne is equal to one billion tonnes). Around 85 per cent of global CO2 emissions were from fossil fuels and 15 per cent from land-use change.
Emissions reached an all-time high of 42.9 ± 2.8 Gt CO2 in 2019. Emissions resulting from land-use change were higher in 2019 than the decadal average due to increased fire activity, particularly in Brazil.
The uptake of carbon into ocean and land sinks has grown in response to the accumulation of CO2 in the atmosphere. In the decade from 2009 to 2018, the ocean and land sinks removed on average 9 ± 2 and 12 ± 2 Gt of CO2 per year, respectively. Combined, these sinks are removing more than half of all CO2 emissions from human activities and thus are slowing the rate of increase in atmospheric CO2. Despite this important uptake by the land and ocean sinks, atmospheric CO2 has continued to increase, growing by 18 Gt CO2 per year over the decade from 2009 to 2018.